BITCOIN → Retest 86190. There are chances for growthBINANCE:BTCUSD is starting to show positive signs, but it is too early to talk about a change in the downtrend or a bullish rally. Strong resistance ahead....
Against the background of everything that is happening, from a fundamental point of view, bitcoin in general has withstood the blows quite well and is gradually beginning to recover, but the situation for the crypto community as a whole has not changed in any way, the promises are not yet fulfilled. Bitcoin's strengthening is most likely due to localized growth in indices and discussion of lower interest rates. But the focus is on the tariff war between China and the US, improved relations and lower tariffs could weaken bitcoin.
Technically, we see that the price is moving beyond the resistance of the descending channel. For a few days now, the price has been consolidating in front of the 86190 level, and we have chances to see a rise to the resistance of the 88800 range, from which the future prospects will already depend.
Resistance levels: 86190, 88800, 91280
Support levels: 83170, 78170
The price is slowly approaching the resistance 86190, consolidating without updating the local lows, forming a pre-breakout consolidation. There is a probability of a breakout attempt. Breakout and consolidation of the price above 86190 may give a chance to rise to 88800.
But, regarding 88800 we will have to watch the price reaction. A sharp approach with the purpose of primary testing of the level may end in a false breakout and correction....
Regards, R. Linda!
Wedge

BITCOIN - Price can little correct and then make impulse upHi guys, this is my overview for BTCUSDT, feel free to check it and write your feedback in comments👊
Recently price broke through the $79500 zone after a long phase of flat consolidation and sharp shakeout.
Once bulls reclaimed control, price formed a clean breakout and started building structure inside a wedge.
Momentum carried the price upward, with buyers defending each local dip and creating a stair-step rise.
Now BTC is moving steadily inside the wedge pattern, holding the lower trendline with no strong rejection.
Price is slowly grinding toward the key resistance around $88500, where volatility might return.
If this tempo holds, I expect BTC can grow higher and tag the $91000 points in the next impulsive leg.
If this post is useful to you, you can support me with like/boost and advice in comments❤️

GOLD (XAUUSD): Classic Trend-Following Pattern
Gold closed on Thursday, forming a bullish flag pattern
on an hourly time frame.
The flag reflects a correction that the market started after a completion
of a strong bullish wave.
A breakout of its resistance line and a candle close above will signify
a highly probable resumption of the trend.
With a high probability, the price will move up at least to a current ATH.
(Remember that the price may respect a trend line one or several times more
and a correction can be more extended, that is why we rely on a breakout of a reliable trigger).
❤️Please, support my work with like, thank you!❤️
I am part of Trade Nation's Influencer program and receive a monthly fee for using their TradingView charts in my analysis.

EURO - Price can fall to $1.1200 points, exiting from triangleHi guys, this is my overview for EURUSD, feel free to check it and write your feedback in comments👊
Price first broke out of a falling wedge pattern, kicking off a sharp rally that gained serious momentum.
The move ran into resistance at $1.1440, where price began stalling and transitioned into a triangle setup.
Since then, price has been wedged inside the triangle, testing highs but struggling to break convincingly.
The support trendline still holds, but each push upward is met with rejection near the resistance ceiling.
Momentum is fading, and with volume drying up, a downside move is becoming more likely from this zone.
I expect that the Euro can break lower from the triangle and fall to $1.1200 points in the upcoming sessions.
If this post is useful to you, you can support me with like/boost and advice in comments❤️

USDJPY - Already Over-Sold!Hello TradingView Family / Fellow Traders. This is Richard, also known as theSignalyst.
📈USDJPY has been overall bearish trading within the falling wedge pattern marked in blue and it is currently hovering around the lower bound of it.
Moreover, the orange zone is a strong weekly support.
🏹 Thus, the highlighted blue circle is a strong area to look for buy setups as it is the intersection of support and lower blue trendline acting as a non-horizontal support.
📚 As per my trading style:
As #USDJPY approaches the blue circle zone, I will be looking for bullish reversal setups (like a double bottom pattern, trendline break , and so on...)
📚 Always follow your trading plan regarding entry, risk management, and trade management.
Good luck!
All Strategies Are Good; If Managed Properly!
~Rich
Disclosure: I am part of Trade Nation's Influencer program and receive a monthly fee for using their TradingView charts in my analysis.

GOLD → Recovery after the FB of 0.5 fibo. What's next?FX:XAUUSD on Thursday tests 0.5 fibo, which I outlined to you on April 17, forms a false breakdown and recovers amid unstable geopolitical relations in the world. Price may continue its northward run.
The dollar continues to fall. The fundamental background depends on the relationship between the US and China as well as economic data especially after Powell's speech. The weekly session closes close to support, the decline may continue.
Gold after the shakeout is heading back north. Based on the fundamental background, the price may continue to rise. There are three days of downtime ahead as traders rest.
Fundamentally, anything can happen over the weekend, however, technically, the emphasis is on intermediate levels. The trend is still strong and bullish
Resistance levels: 3332, 3344, 3357
Support levels: 3313, 3288, 3284
If nothing supernatural happens over the weekend, gold in the Asian session may bounce off the nearest resistance and test trend support before continuing the uptrend. If there are any critical changes in the mood of countries/politicians then I will update the situation
Regards R. Linda!

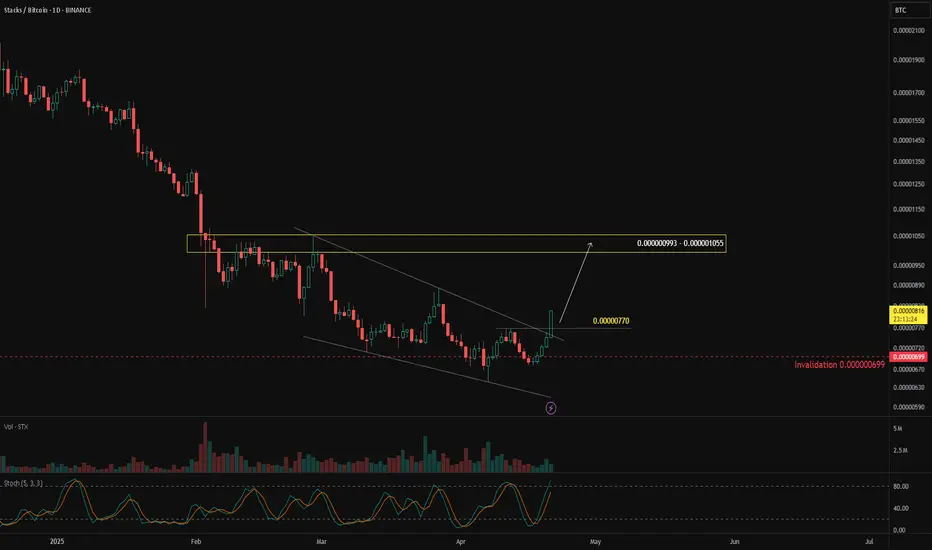
Will STX Outperform Bitcoin?In the crypto market, if you want to beat the market, your benchmark is $CRYPTO:BTCUSD. That means to outperform the crypto market, you need to outperform Bitcoin.
One way to measure this is by watching crypto/BTC pairs, such as $BINANCE:STXBTC. If $BINANCE:STXBTCgoes up, it means STX is stronger than BTC. If it goes down, BTC is stronger than STX.
On the daily chart, BINANCE:STXBTC has been moving downward, but over the past month, sellers seem to be losing momentum—indicated by a falling wedge reversal pattern.
A bullish breakout above 0.000000770 would confirm the pattern, with a potential upside target at 0.000000993 – 0.000001055. This scenario remains valid as long as price holds above 0.000000699.
Euro may correct to support area and then rebound upHello traders, I want share with you my opinion about Euro. Looking at the chart, we can see that the price started its growth from the buyer zone between 1.0730 - 1.0785 points, where the price found strong support near the lower boundary of the broadening wedge. After bouncing off that zone, Euro gained momentum and made an impulsive move upward, breaking through the resistance line and establishing a bullish trajectory. Once the pair overcame the 1.1265 level, which is now acting as current support, the price entered a period of consolidation inside the support area between 1.1310 - 1.1265 points. This zone is showing signs of strength again, with the price attempting to stabilize above it. The overall structure continues to respect the boundaries of the broadening wedge, with higher highs and higher lows confirming bullish control. At the moment, EUR is correcting slightly after reaching local highs and is approaching the support area again. A healthy pullback toward 1.1310 - 1.1265 would be in line with the pattern and could trigger the next bullish impulse. Given the ongoing upward structure, the strong support area, and the clear wedge formation, I expect Euro to continue growing toward the upper wedge boundary near 1.1555 points, which is my current TP1. Please share this idea with your friends and click Boost 🚀

Uj might be reversing- We are at a painfully large demand area.
- Price squeezing and consolidating in a dropping wedge.
- Thursday candle was a bullish harami (indicating a possible u-turn)
- Friday was the Good Friday (Market holiday), so it doesn't count
Let us patiently wait here for the price to either break the wedge or at least it hits the lower border of the wedge to place our first entry. The reversal is imminent provided we do not break the demand area. Patience is the key here.
Once we have a full confirmation to buy we will look further for targets, till then just watch it.
I will update you guys when I place my own entry. Pray hard, trade smart :) and best of luck!
Here is the close up look of the wedge:

GOLD - Price can make correction and then continue to growHi guys, this is my overview for XAUUSD, feel free to check it and write your feedback in comments👊
Price broke out from the lower wedge line and started climbing with confidence, building momentum step by step.
After bouncing off the $3215 zone, it pushed higher and touched the wedge resistance without major rejection.
The current candle formation shows signs of slowing down, hinting at a possible short-term pullback ahead.
Despite that, the structure remains bullish, and buyers are likely to defend local support if the price dips slightly.
With the breakout zones holding firm, I expect Gold to make a correction and then resume the upward path.
My target is set at $3500, where the upper wedge boundary might once again act as key resistance.
If this post is useful to you, you can support me with like/boost and advice in comments❤️

CHFJPY: Back to the Trend?! 🇨🇭🇯🇵
CHFJPY looks bullish after a test of a key daily horizontal support.
It looks like the correction that we currently see on intraday time frames is over.
As a confirmation, I see a bullish breakout of a resistance line of a bullish flag
pattern on an hourly time frame.
Goal - 175.62
❤️Please, support my work with like, thank you!❤️
I am part of Trade Nation's Influencer program and receive a monthly fee for using their TradingView charts in my analysis.

HBAR Falling Wedge / Bull Pennant + RSI breakout (1D)BINANCE:HBARUSDT has spent months correcting after a strong rally and is now compressing within a falling wedge — which could also be interpreted as a bull pennant.
Two Potential Scenarios
• Falling Wedge – A classic reversal setup with bullish RSI divergence and declining volume. Measured target: ~$0.335.*
• Bull Pennant – A continuation pattern formed after the late-2024 impulse. Measured target: ~$0.525.*
Early Bullish Signs
• Declining volume as the pattern developed could signal waning seller strength.
• RSI breaking out of a multi-month downtrend, and retesting the resistance as support, can be a leading signal of a subsequent price breakout.
Key Levels
• $0.050 – Multi-year demand zone.
• $0.120 – Current support + HVN* + previous S/R + 0.786 Fib.
• $0.180 – Resistance + HVN + previous S/R + 0.618 Fib.
• $0.280 – HVN + prior swing high + likely resistance.
• $0.320–$0.460 – Monthly supply zone (in place since March 2021).
• $0.335 – Falling wedge measured target (depending on breakout timing)**.
• $0.360–$0.400 – Daily sell-side order block, expect resistance.
• $0.525 – Bull pennant target (depending on breakout timing)**.
* Wedge and pennant targets are measured from the breakout point, so the actual target will vary the longer we spend within the pattern.
** HVN: High Volume Node — zones of concentrated past trading activity, reinforcing S/R relevance.
⚠️ Until a clean breakout occurs, CRYPTOCAP:HBAR remains in a compression phase and a No-Trade Zone.

GOLD v DXY in breakout move --- HVF hunt volatility funnelAlways good to measure against the DXY not just the USD value
Not perfect of course as it is mainly the Euro and Yen but still insightful.
Been watching the relationship for a while
currently breaking out to the upside
HVF theory means this should be a violent expansion
Target 1 coming up.

Gold can exit from wedge and drop to support levelHello traders, I want share with you my opinion about Gold. Price action on Gold has shown strong bullish momentum earlier, as it broke out of the previous upward channel and started forming an upward wedge. The rally gained traction once the price left the buyer zone between 3006 - 3025 points, pushing through multiple resistance levels and creating a new structure of higher highs. After the breakout from the wedge’s support line, the price continued to grow and eventually reached the upper boundary of the wedge pattern. Here, we saw a clear reaction and reversal, signaling potential exhaustion among buyers. Currently, the price is trading just below the upper wedge resistance and has already made a pullback after the latest local high. Given this structure and the fact that the wedge pattern is tightening, I expect gold to reverse again and decline toward 3270, which is my first TP. If pressure continues, the price may drop to the 3210 current support level as TP2. The reaction from the upper wedge boundary, combined with weakening momentum and a strong support area below, supports my bearish outlook for now. Please share this idea with your friends and click Boost 🚀

XLM Falling wedge? Looks like a textbook falling wedge. Market is slow but if sentiment changes XLM could do some things.

VANA Breakout in Sight as Accumulation Nears CompletionVANA appears to be finalizing a descending wedge structure with a potential 5-wave completion into the immediate demand zone. A final dip toward the $4.20–$3.20 accumulation range could offer an ideal entry before a bullish reversal targets $7.26, $9.76, and potentially $17.71. Strong reaction expected once this accumulation phase concludes.

BBAI clear Divergence Not financial advice.
There is a clear positive bull divergence with RSI and any breakout of this downward triangle we shall expect a reversal and increase of the price upward fast.
Thanks 🫶

RDDT Long @ 93.44
It looks like there is a head and shoulders pattern lining up with a falling wedge pattern that could indicate a jump in RDDT share price. I'm entering a long position @ 93.44.
This is not investment advice and I'm just getting started with pattern analysis so please don't trust me :)

OP/USDT Secondary trend. Wedge. Pivot zones. 27 07 2024OP/USDT Secondary trend. Wedge. Pivot zones. 27 07 2024
Logarithm. Time frame 3 days. A descending wedge is forming. The price is near the dynamic Gann support (reaction from it), but still in the range of the descending wedge pattern. The reaction in this resistance zone will determine the trend for the near future.
On the chart, I have specifically shown the minimum percentages of the two key reversal zones for the trend to local resistance levels, for the potential of option A and B.
Major trend.
OP/USDT Major trend. 07 2024 Time frame 1 week.

LOFI Surge Nearly 200% Today Breaking Out of A Falling Wedge The price of Lofi saw an uptick of almost 200% despite albeit the crypto market was consolidating, breaking out of a falling wedge pattern.
$LOFI, a memecoin created on the Sui ecosystem has been on a prolong falling wedge pattern that led to the token losing about 93% of market value. However, in a turn of events today, $LOFI surge nearly 200% today going against market odds.
As of the time of writing, $LOFI is up 55% for the past 24 hours with momentum brewing as hinted by the RSI at 88. The relative strength index shows $LOFI is oversold, meaning we might experience a slide cool off before another leg-up.
About Lofi
LOFI leverages the Sui blockchain to build a thriving ecosystem focused on content, community, and collaboration. Committed to environmental and social causes, $LOFI merges blockchain technology with real-world impact, aiming to clean Earth’s water sources and reduce ocean plastic while fostering a decentralized economy.
LOFI Price Data
The LOFI price today is $0.024751 USD with a 24-hour trading volume of $4,981,833 USD. LOFI is up 53.48% in the last 24 hours. The current CoinMarketCap ranking is #696, with a market cap of $24,750,635 USD. It has a circulating supply of 1,000,000,000 LOFI coins and a max. supply of 1,000,000,000 LOFI coins.


Bitcoin can exit from triangle and drop to support levelHello traders, I want share with you my opinion about Bitcoin. The chart shows how the price previously made a strong decline, followed by a sharp rebound from the buyer zone between 77800 - 79000 points. This recovery formed a short-term uptrend, which led the price back into the seller zone, where bullish momentum slowed down. After testing resistance, BTC formed a wedge pattern that eventually broke to the downside, causing a new wave of correction. Following this drop, the market rebounded again from support and began forming a triangle pattern. The triangle developed inside the same larger resistance area that had already rejected price action before. The structure of the triangle shows lower highs with clear resistance along the 88500 level, reinforcing bearish pressure. Currently, BTC is trading near the apex of this triangle, and the price just bounced down again from resistance. This reaction suggests that the market is struggling to push higher and could be ready for a breakdown. Based on the triangle structure, the seller zone rejection, and the multiple failed attempts to break higher, I expect BTC to move downward toward the 80000 points, which I consider as TP1. The 79000 - 80000 area also coincides with the next major support and previous accumulation zone. Please share this idea with your friends and click Boost 🚀

XAUUSD FALLING WEDGE PATTERNI Created This XAUUSD Chart Analysis In 30-M Tf
Entry: BUY from 3315
Support zone : 3312
Target Will Be : 3355
OANDA:XAUUSD made Falling wedge Pattern, It went to Uptrend, Let me know your thoughts in comments section

#PARTIUSDT is showing signs of a reversal🚀 The price BYBIT:PARTIUSDT.P is showing signs of a reversal after a prolonged downtrend.
🚀 The scenario becomes more likely if the price holds above $0.1520 with increasing volume.
🚀 Watch for a breakout and confirmation above the $0.1500–$0.1520 zone — this would strengthen the bullish setup.
🚀 If volume picks up during the continuation of the move, a quick push toward $0.18 is possible.
📈 LONG BYBIT:PARTIUSDT.P from $0.1533
🛡 Stop loss: $0.1492
🕒 Timeframe: 1H
✅ Overview:
➡️ The price has broken out above the Bearish Flag, confirming a break in the downtrend structure.
➡️ The Double Bottom formation increases the likelihood of an upward move.
➡️ Entry at $0.1533 is just above the resistance zone and confirms the breakout.
➡️ The upward potential remains toward $0.1600 and beyond, aiming for the POC volume area.
🎯 TP Targets:
💎 TP 1: $0.1555
💎 TP 2: $0.1575
💎 TP 3: $0.1600
📢 Support zone: $0.1500–$0.1510 — must hold to maintain the bullish structure.
📢 If price consolidates above $0.1555, expect a potential acceleration toward $0.1600.
📢 A drop below $0.1492 invalidates the scenario — stop is mandatory.
🚀 BYBIT:PARTIUSDT.P breaks key level — bullish signal confirmed! Watch for continuation!
