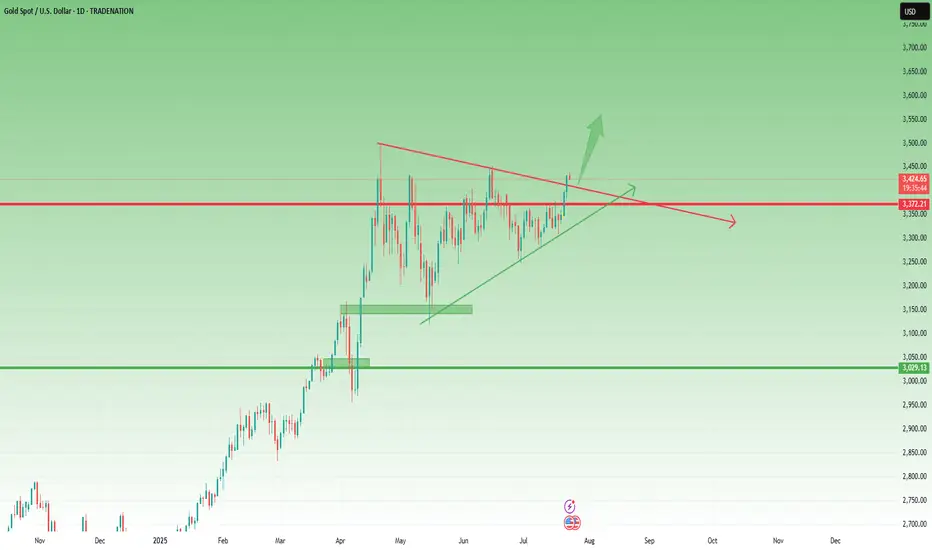
Gold Update – Strong Breaks, Strong BullsYesterday, after the break of the key 3370 resistance, Gold corrected slightly toward 3383, then consolidated briefly in that area. From there, it launched into a strong new leg up, closing the day once more near the highs, around 3430.
📌 What’s important here is that the price did not even come back to retest the broken resistance — now turned support. Combined with the strong daily close near the high of the range, this gives us a clear message:
➡️ Bulls are in full control.
________________________________________
🔍 This Week – Three Key Breaks
So far this week, Gold has delivered three major breakouts:
• ✅ A clean breakout from the box consolidation that kept price stuck and indecisive last week
• ✅ A decisive break above the 3400 psychological figure
• ✅ A breakout above the symmetrical triangle resistance, which had been forming since late April
Each of these is significant on its own. Together, they suggest a shift toward a more aggressive bullish scenario.
________________________________________
🔮 What’s Next?
All these breakouts point to the potential for more gains ahead.
In fact, the next logical step could be an attempt to mark a new All-Time High.
My view remains the same:
Buying dips remains the strategy of choice, with a focus on the 3400 zone as a key support area, and a swing target around 3500.
Disclosure: I am part of TradeNation's Influencer program and receive a monthly fee for using their TradingView charts in my analyses and educational articles.
Xauusdanalysis
XAUUSD 30-Min Chart Analysis: Bullish Move Toward Resistance This 30-minute chart of XAUUSD (Gold vs. USD) shows key support and resistance levels. The price is currently around 3,422.615. Resistance is marked at 3,447.337, while the first and second support levels are at 3,412.474 and 3,404.985, respectively. The chart suggests a potential bullish move toward resistance.

Gold will pause its rally today. Be cautious✏️ OANDA:XAUUSD continues to hit new highs this week. As the daily candle closes above the 3430 area, gold is creating a wide trading range of about 50 prices today. The uptrend may face a slight slowdown due to profit-taking psychology of some investors.
📉 Key Levels
Sell trigger: Rejection from 3445
Sell zone: 3463
Target: 3405
BUY trigger: 3402 (Price retests breakout zone and buyers react)
Leave your comments on the idea. I am happy to read your views.
Price channel break. Will the downtrend take place?✏️USDCAD broke the price channel and started forming a bearish wave. The resistance zone of 1.370 played an important role in starting the bearish wave. 1.365 is the immediate support zone that the pair faces. If it wants to extend the decline, it needs to close the h1 candle below this price zone. The convergence between the trendline and the resistance of the Asian session will be a reliable support point for a downtrend to take place.
📉 Key Levels
Support: 1.365-1.356
Resistance: 1.370
SELL Trigger: Rejects bellow 1.370
SELL DCA Trigger: Break support 1.365
Target 1.356
BUY Trigger: Break and trading above resistance 1.370
Leave your comments on the idea. I am happy to read your views.

Gold technical outlook – Signs of exhaustion at channel topOANDA:XAUUSD is climbing within a well-defined ascending channel, and price is now brushing up against the upper boundary, a dynamic resistance zone that has historically triggered pullbacks. If price gets rejected here, we may see a healthy correction toward the key support at 3,350, offering a potential reload point for bulls.
Should buyers step in and defend this level, the bullish structure remains intact, setting the stage for a renewed push higher. On the other hand, a clean break below 3,350 could open the door for a deeper retracement toward the lower edge of the channel, where more significant demand may lie.
All eyes should be on price action and volume in this regio, watch for reversal patterns like bullish pin bars or engulfing candles to confirm entries. As always, risk management comes first. Don't trade assumptions, trade confirmations.
What’s your take on this setup? Drop your thoughts below and let’s discuss!

Gold - Above 3370 Is Bullish Territory – But 3360 Must Hold📆 What happened yesterday?
After more than a week of frustrating, sideways price action, Gold finally broke out above the key 3370 resistance zone.
The breakout was clean and impulsive, with TRADENATION:XAUUSD pushing to an intraday high around 3400.
Following that move, price printed a small double top near the high and began a modest correction — perfectly normal after such a breakout. At the time of writing, Gold trades at 3385, still holding above former resistance.
📈 Why this breakout matters:
The daily close at 3396 came in strong and near the top, leaving behind a clear Marubozu candle
This kind of price action signals conviction and momentum
The breakout confirms what I’ve been anticipating for days — the range is resolved, and the market is choosing the bullish path
🎯 What to expect next:
If price stabilizes above 3400, the road to 3450 opens — which is the target mentioned in my previous analyses
That area represents the next major resistance and likely magnet for price if bulls stay in control
🧭 Trading Plan:
For me, the plan is now simple:
✅ Buy the dips — especially on a potential retest of the 3370–3375 broken resistance, which now turns into support
❌ Negation comes only with a daily close below 3360, which would invalidate this breakout and raise questions
📌 Conclusion:
The breakout has finally come. After days of coiling, Gold chose the upside.
Momentum is building, structure is clean, and bulls are back in control — unless 3360 fails.
Until then, I remain bullish, looking to buy dips into strength. 🚀
Disclosure: I am part of TradeNation's Influencer program and receive a monthly fee for using their TradingView charts in my analyses and educational articles.
After reaching FULL TP. Relax and wait for strong support zone✏️Continuing yesterday's bullish wave structure, Gold has reached the Target level of 3400. In the European session, there is a possibility of a correction to some important support zones. And the US session will continue to aim for a level higher than 3400. Today's strategy is still quite similar to yesterday's strategy when waiting for the areas where buyers confirm to enter the market to FOMO according to the main trend.
📉 Key Levels
Support: 3375 - 3363
Resistance: 3400-3427
Buy Trigger: Rejects the support zone 3375 and reacts to the upside
Buy Trigger: Rebound from 3363
BUY DCA: Break and trading above 3400
Target 3427
Leave your comments on the idea. I am happy to read your views.
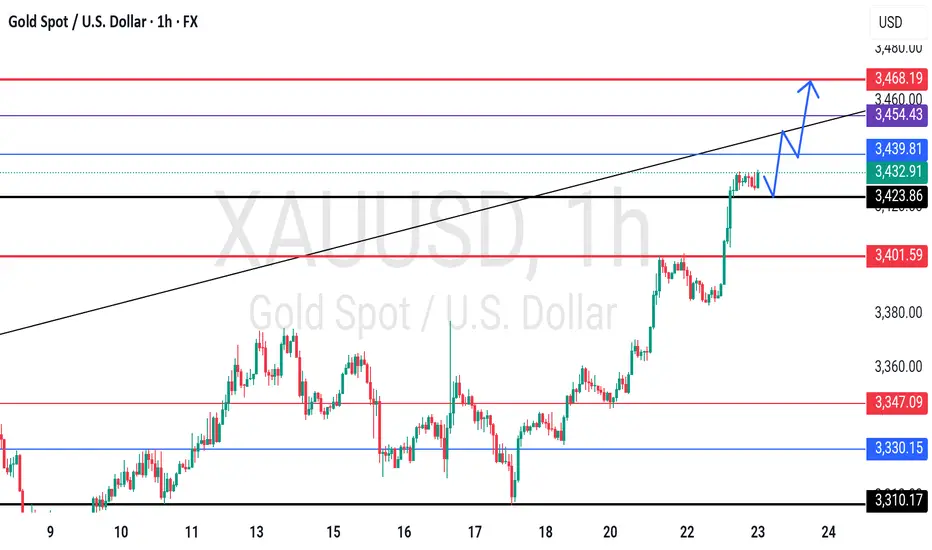
XAUUSD (1H Time frame) Read the captionXAU/USD Analysis (1H Timeframe )
This chart represents the XAU/USD (Gold vs US Dollar) price movement on a 1-hour timeframe, showcasing a well-defined ascending channel. The analysis highlights three critical zones:
1. Resistance Level (Upper Blue Zone):
This zone, located around the $3,440 - $3,450 range, marks the potential upper limit of the current bullish channel. A breakout above this level could indicate strong bullish momentum continuation.
2. Key Support Breakout Zone (Middle Purple Zone):
Around the $3,390 - $3,400 range, this area previously acted as resistance and now serves as a key support level. A price retest and bounce from this zone could confirm it as a new support base, potentially triggering a move toward the resistance zone again.
3. Support Level (Lower Purple Zone):
Found near the $3,320 level, this is the broader trendline and horizontal support zone that would be critical if the price breaks below the key support area. It acts as a major demand zone within the ascending channel.
Observations:
The price is currently in a strong uptrend within the rising channel.
A retest of the key support breakout zone is anticipated before potentially pushing higher toward resistance.
A breakdown below the key support could trigger a move toward the lower support level.
Technical Bias:
Bullish as long as the price remains above the key support level.
Bearish reversal may occur on a confirmed breakdown below the ascending channel and lower support zone.

XAUUSD analysis - 1H FVG and OB setupsOn the 1H timeframe, price is reacting as it approaches the HTF high zone (3430-3450) and is currently pulling back.
The 1H FVG zones at:
🔹 3400
🔹 3368
and the 1H OB around 3350 are key areas we are watching for potential long entries.
📌 Plan:
We will wait for price to pull back into one of these 1H FVG/OB zones and look for entry confirmations on the 5M or 3M timeframe to go long.
🎯 Targets: 3430 – 3440 – 3450
❌ No sell setup for now unless a clear structure break happens.

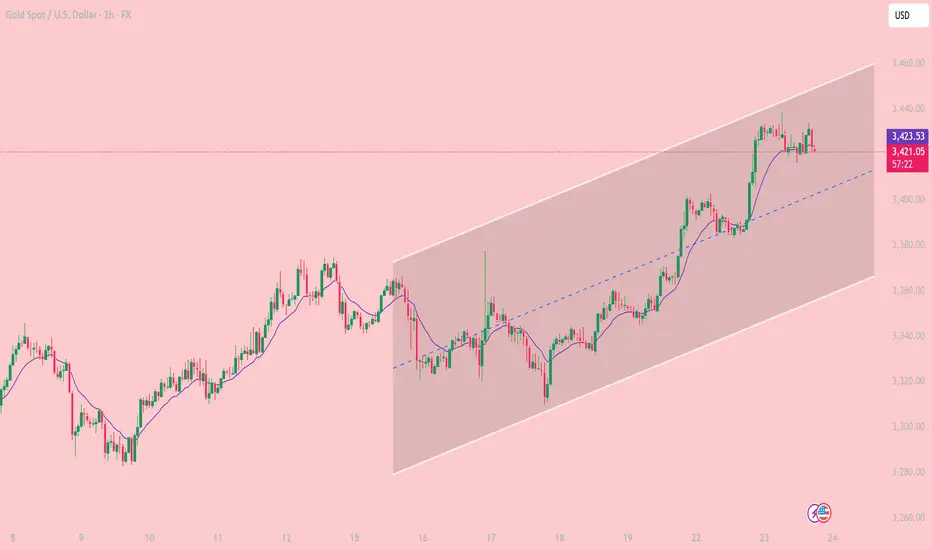
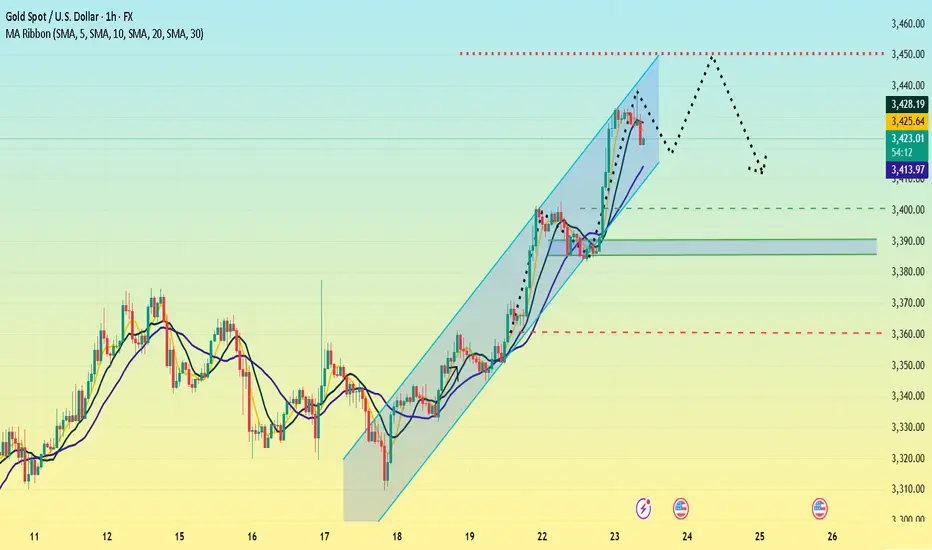
Bullish Channel in Play Key Trading Zones and Strategy for JulyOn the 1-hour chart, XAUUSD is clearly moving inside a well-defined ascending price channel, with price respecting both the channel boundaries and the midline as dynamic support/resistance. The pair continues to print higher highs and higher lows, confirming short-term bullish structure.
Trend Channel: Since July 18, gold has been steadily climbing within an ascending channel, bouncing off the lower boundary and riding above the midline.
EMA Support: The 10-period EMA (purple) has been acting as a dynamic support. Price has yet to close below it during this bullish swing.
Candle Behavior: Recent bullish candles with strong bodies show that buyers still have control, although price is stalling near the upper boundary of the channel.
Technical Level
3,459 USD. Major Resistance. Top of the channel – potential reversal or take-profit zone
3,423 USD.Immediate Support. EMA10 and current consolidation area
3,400 USD. Mid-Channel Support. Key pullback zone if price rejects near highs
3,360 – 3,365 USD. Major Support. Bottom of the ascending channel – break may invalidate bullish setup
Scenario 1 – Buy the Dip (trend continuation):
Wait for price to retest the 3,400 – 3,410 USD area or EMA10.
Look for bullish confirmation (e.g., pin bar, bullish engulfing).
Target: 3,445 – 3,459 USD
Stop loss: below 3,395 USD
Scenario 2 – Short at Channel Top (mean-reversion setup):
Monitor price behavior near 3,455 – 3,459 USD resistance.
If bearish reversal candles appear (e.g., shooting star, bearish engulfing), consider shorting.
Target: 3,420 – 3,410 USD
Stop loss: above 3,465 USD
As long as price remains inside the rising channel, buying pullbacks is the preferred strategy.
Stay alert to macroeconomic catalysts (Fed comments, PMI data, labor market releases) that could increase volatility.
Gold remains in a strong short-term uptrend on the 1H chart. Trading in the direction of the trend with proper risk management continues to offer the best opportunities for intraday traders.
If you found this analysis useful, don’t forget to follow for more trading strategies and ideas!
GOLD (XAUUSD) M30 ANALYSIS Price has tapped into the 4H resistance zone and is showing signs of rejection. A pullback toward the FVG and RBS zones is likely.
If we get a bullish reaction from that area, the uptrend may continue.
🔹 Key Levels:
4H Resistance Zone: 3422 - 3442
FVG Demand Zone: Around 3391 - 3398
RBS (Support): 3384 / 3371 zone
📌 Trade Idea:
– Wait for a pullback
– Look for bullish confirmation near FVG/RBS
– Target: Break above the resistance zone
Let the market come to your zone — no need to rush.

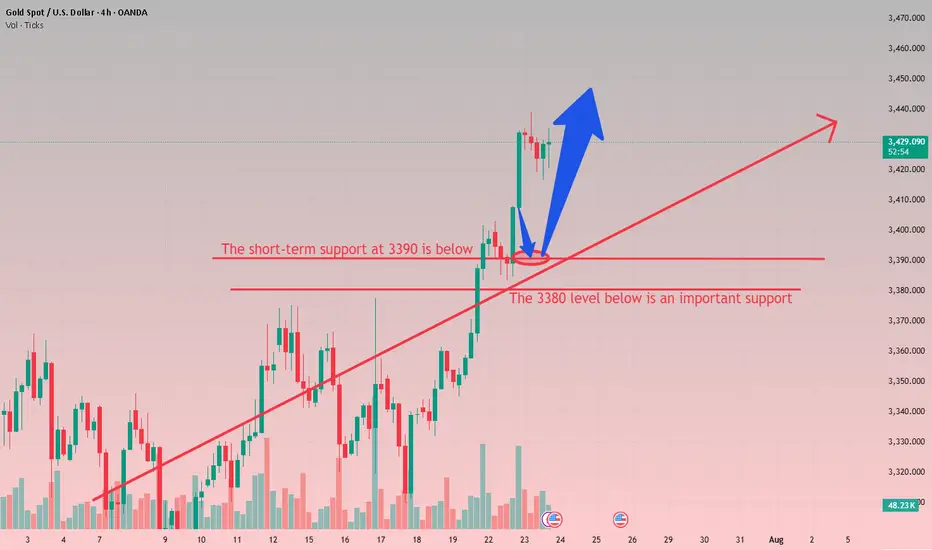
Don't chase gold at high levels, buy more when it falls back to From the 4-hour analysis, today's support is around 3400-10. If the intraday retracement relies on this position, the main bullish trend remains unchanged. The short-term bullish strong dividing line focuses on the 3380 mark. If the daily level stabilizes above this position, the rhythm of retracement will continue. Short positions against the trend should be cautious.
Gold operation strategy:
Gold retracement to 3400-10 line to go long, retracement to 3390-95 line to cover long positions, stop loss 3379, target 3435-3440 line, continue to hold if it breaks;
XAUUSD Breakout Structure | Smart Money Bullish Roadmap 🚨 XAUUSD 2H | Smart Money Concept Setup
Price perfectly tapped into demand zone and showed a strong bullish reaction — now forming a clear BOS (Break of Structure).
📍 Key Liquidity Zones:
• Price swept previous lows and is now targeting major liquidity levels marked as “Target Points.”
• Bullish momentum is expected to push price towards 3410 – 3425 range 📈
🔁 Expect possible consolidation before a continuation to upper targets.
💡 Strategy:
Wait for a minor pullback near the 3380–3390 level for confirmation, then ride the momentum to higher targets.
🎯 Target Levels:
1. 3398 ✅
2. 3410 🚀
3. 3425+ (Final Target)
📌 Like, Follow & Save if you caught this early 📊
#XAUUSD #SMC #LiquidityGrab #GoldSetup #TradingViewIdea #SmartMoney #Breakout

XAUUSD I Potential Pullback and More GrowthWelcome back! Let me know your thoughts in the comments!
** XAUUSD Analysis - Listen to video!
We recommend that you keep this on your watchlist and enter when the entry criteria of your strategy is met.
Please support this idea with a LIKE and COMMENT if you find it useful and Click "Follow" on our profile if you'd like these trade ideas delivered straight to your email in the future.
Thanks for your continued support!

Gold Fails at Resistance, Elliott Wave Signals Deeper CorrectionGold ( OANDA:XAUUSD ) started to rise after the Richmond Manufacturing Index(Actual:-20/Forecast:-2/Previous-7) index was announced, but failed to break the upper line of the ascending channel and the Resistance zone($3,451-$3,406) .
Gold has now broken through the Support lines and is attempting to break through the next Support lines and Support zone($3,394-$3,366) .
In terms of Elliott Wave theory , it appears that the main wave Y has completed above the ascending channel.
I expect that given the momentum of gold's decline , gold will be able to break the Support zone($3,394-$3,366) and Support lines and fall to at least $3,356 . The next target could be the lower line of the ascending channel .
Note: Stop Loss (SL) = $3,423
Gold Analyze (XAUUSD), 1-hour time frame.
Be sure to follow the updated ideas.
Do not forget to put a Stop loss for your positions (For every position you want to open).
Please follow your strategy; this is just my idea, and I will gladly see your ideas in this post.
Please do not forget the ✅ ' like ' ✅ button 🙏😊 & Share it with your friends; thanks, and Trade safe.

XAUUSD Monthly Technical OutlookMarket Structure Overview:
• The chart reveals consistent Breaks of Structure (BOS) to the upside, confirming a strong bullish market trend.
• Price has successfully reclaimed and retested the strong resistance zone (~3390–3400), which now acts as new support.
• A series of higher highs and higher lows show clear bullish intent, supported by sustained bullish momentum after each correction.
⸻
📈 Volume & Price Action:
• The Volume Profile (VRVP) on the left shows strong historical accumulation near the current breakout zone.
• After the breakout from resistance, the price retested this zone—validating it as support—and is expected to continue its bullish leg toward $3,500, the next psychological and technical target.
⸻
📍 Key Levels:
• Support Zone: $3,375 – $3,390 (previous resistance turned support)
• Immediate Resistance: $3,425
• Target Level: $3,500 (Monthly High Projection)
⸻
📘 Educational Note:
• This setup aligns with classic market structure theory: BOS + Retest + Continuation.
• The pullback into the breakout zone is a textbook bullish continuation signal often used in institutional trading strategies.
• Traders watching this pattern should combine it with confirmation entries such as bullish engulfing candles, FVGs, or order block rejections for safer entries.
⸻
🎯 Projection:
• As long as the price holds above $3,375, the bullish scenario toward $3,500 remains valid.
• Expect possible consolidation or minor pullbacks before continuation.
⸻
📌 Disclaimer:
This analysis is for educational purposes only and does not constitute financial advice. Always do your own research before entering the market.

GOLD - single supporting area, further bounce??#GOLD - market perfectly moveed as per our video analysis and above our cut n reverse area as well.
Now market have single supporting area, tha tia around 3423-24
Keep close it and if market hold it then upside further bounce expected.
Good luck
Trade wisely
XAUUSD Bullish Setup | Liquidity Grab to Breakout📊 XAUUSD Bullish Breakout Plan | Price Action + Key Levels Analysis 🔥
Gold (XAUUSD) is currently holding above a strong support-turned-resistance zone around $3,340 - $3,345. After a clear rejection from the support area and a bullish structure forming, price is showing potential for a clean breakout toward higher targets.
🔍 Key Technical Highlights:
• Support Area: $3,310 - $3,320 held strongly
• Resistance Flip: $3,345 zone acting as new demand
• Target 1: $3,375
• Target 2: $3,390 major liquidity zone
• Structure: Bullish W pattern forming above demand
This setup favors buy on retracement, aiming for breakout above recent highs. Wait for a confirmation candle above resistance before entering.
📈 Watch for liquidity grab and strong bullish impulse.
#XAUUSD #GoldAnalysis #SmartMoney #BreakoutSetup #LiquidityHunt #ForexTrading #TechnicalAnalysis #BuySetup #PriceAction #TradingView #GoldSetup #ForYou

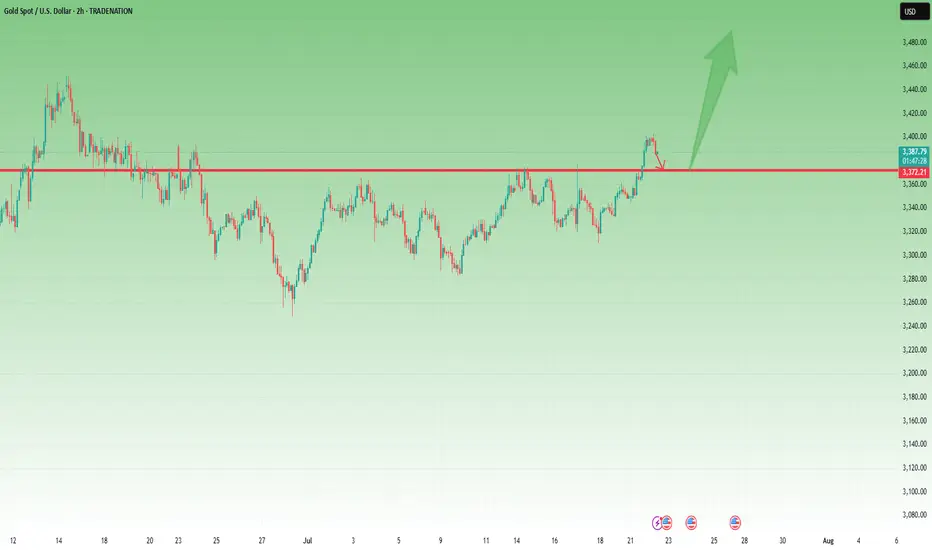
Gold stabilizes. Sets a new high?Gold continues to rise, with uncertainty in trade negotiations and the outcome of the Federal Reserve meeting being key variables. If no agreement is reached before August 1, the high tariffs imposed by the United States on major trading partners may trigger greater risk aversion demand, pushing gold prices further up; if the negotiations make a breakthrough, the market risk appetite will rebound, and gold prices may face correction pressure.
Gold has shown a strong upward trend recently. It closed with a small positive on Friday last week and closed with positive for two consecutive trading days this week, forming a three-day positive trend, with strong short-term momentum. In terms of indicators, the moving average diverges upward, with obvious bullish trend characteristics, and the support below needs to focus on the moving average performance. At present, the gold price has broken through the trend line formed by connecting the previous high points. The primary focus on the upside is near the previous high of 3452, which is an important short-term resistance level. The upper focus is on the previous high of 3452, which is an important short-term resistance level.
The first support below is the 3390-3385 area, which is close to yesterday's low and is also an early trading intensive area. The second support focuses on the vicinity of 3360.
In terms of operation, it is still mainly low-long, and short selling is not considered before the upward trend reaches 3450.
Operation strategy:
Short around 3450, stop loss 3460, profit range 3430-3310
Long around 3400, stop loss 3390, profit range 3420-3430
XAU/USD Chart Analysis: Bulls Break Important ResistanceXAU/USD Chart Analysis: Bulls Break Important Resistance
When analysing the XAU/USD chart last week, we:
→ noted that the ADX indicator had reached its lowest level since the beginning of 2025 – a clear sign of declining gold price volatility;
→ highlighted the formation of a large-scale triangle with its axis around the $3,333 level, bounded by a resistance line (marked in red) and the lower boundary of the ascending channel.
Since then, the price has climbed above $3,400 – reaching its highest level since mid-June. According to media reports, the uptick in demand may be driven by escalating geopolitical risks, renewed optimism regarding potential monetary policy easing in the US, and consistent gold buying from central banks.
This suggests that the balance has shifted in favour of the bulls, who have made an attempt to break through the resistance line – an attempt that, so far, appears promising and points towards a potential resumption of the upward trend.
However, today's XAU/USD chart shows that the bulls are now facing a key resistance level at $3,440 – a level that has reversed gold prices downward both in May and June. What will happen in July?
It is possible that, following a prolonged consolidation near the lower boundary of the channel, the bulls have built up sufficient momentum to finally break through this critical level and push gold prices towards line Q, which divides the lower half of the long-term channel into two quarters.
This article represents the opinion of the Companies operating under the FXOpen brand only. It is not to be construed as an offer, solicitation, or recommendation with respect to products and services provided by the Companies operating under the FXOpen brand, nor is it to be considered financial advice.

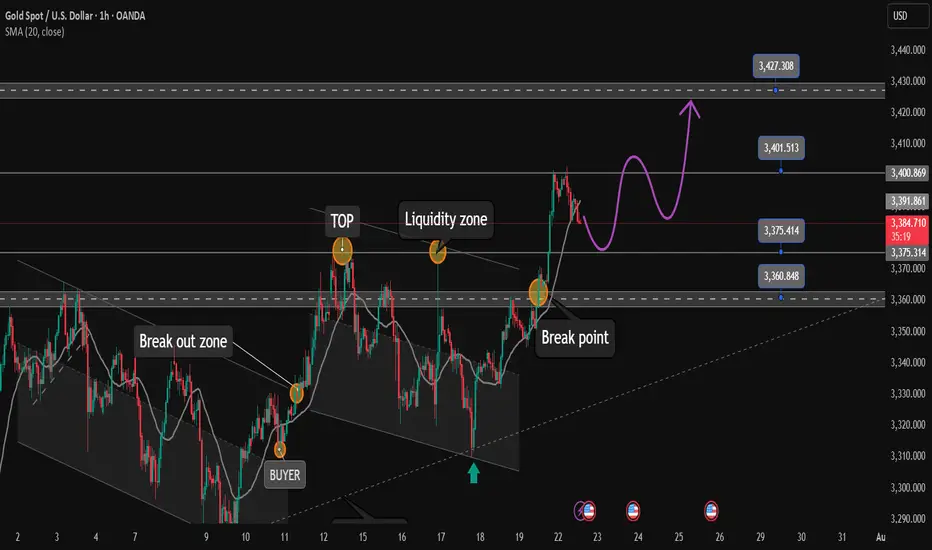
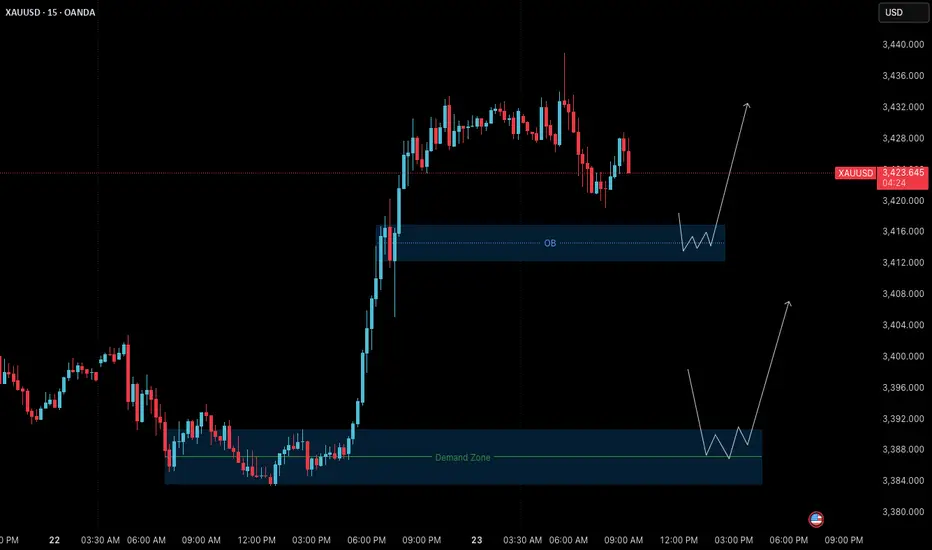
Gold Outlook (23 July): Bullish Structure Retesting Key ZonesGold (XAUUSD) – 23 July Analysis
Structure, patience, and precision define today's opportunity
The market remains in a clear uptrend , and the current M15 structure is undergoing a healthy pullback phase following yesterday’s strong bullish breakout. This retracement brings the price into key zones where continuation setups may form — if confirmed.
📊 Market Structure Overview
• Bullish Breakout: On July 22, price made a strong impulsive move upward from the demand base at 3384–3390 , confirming bullish strength and shifting short-term structure to the upside.
• Current Pullback: After printing a local high around 3439 , the market is retracing toward lower support zones. The pullback is expected and may offer long entries if price respects key areas and confirms.
🔑 Key Reversal Zones to Watch
1. Order Block (OB) Zone
Range: 3417 – 3412
– This zone is the origin of the last bullish impulse.
– Price is nearing this key zone.
– If M1 confirms with internal structure shift + BoS , we may have a valid long setup.
– Target: Previous high at 3438–3440
2. Deeper Demand Zone
Range: 3390 – 3384
– This is the base of the prior impulsive leg.
– If price breaks below the OB with momentum, this deeper zone may act as stronger support.
– Potential swing entry zone with better R:R
📌 Trade Scenarios for Today
🔹 Scenario 1: Rejection from OB Zone (Likely Intraday Setup)
– Wait for M1 to confirm via micro ChoCh + BoS inside 3417–3412 zone.
– If confirmed, plan for long entry with SL below zone.
– Target: 3438–3440
🔹 Scenario 2: Break Below OB → Retest at Deeper Demand Zone
– If OB zone fails, wait for price to drop into 3390–3384.
– Look for M1 confirmation before executing any long position.
– This setup may offer a higher-quality entry with improved R:R.
📈 Trade Plan:
– Wait for confirmation before entry (e.g., M1 structure shift + BoS)
– SL: 40 pips | TP: 120 pips
– Risk-Reward: Always 1:3 minimum
– No confirmation = No trade
🎯 Summary
• Primary Bias: Bullish — monitoring OB zone (3417–3412) for long setup
• Alternative Setup: Buy from 3390–3384 demand if deeper retracement unfolds
• Discipline: Let the market validate your plan. Never force a trade.
📘 Shared by @ChartIsMirror
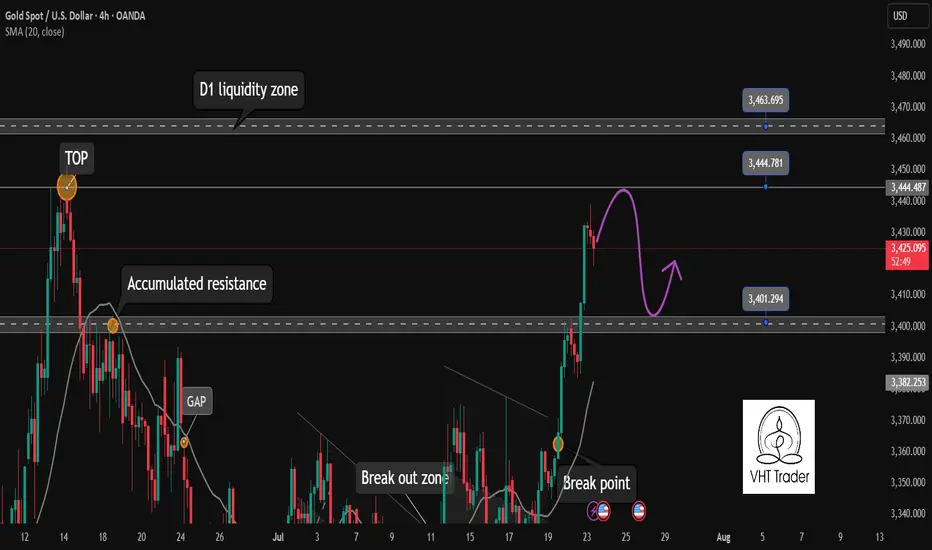
Gold Price Analysis July 23📈 Gold Trend Analysis – Strong Uptrend but Signs of Slowdown
Gold continued to set a new peak for the week when closing the day above 3430 – confirming that the uptrend is still dominant. However, buying power is starting to slow down as the market formed a fairly wide range, around 50 prices in today's session.
Profit-taking pressure at high prices can create a short-term correction, opening up two-way trading opportunities for flexible investors.
🔑 Important technical levels (Key Levels):
🔻 Resistance zone & Sell zone:
3445: Price rejection zone – can consider selling if price fails to break through.
3463: Strong Sell zone – expect increased supply here.
🎯 Sell target:
3405: Nearest support, target for short-term sell orders.
🟢 Buy Setup:
3402: Breakout zone in US session – if price breaks strongly through this support with good volume, consider buying on the next uptrend.

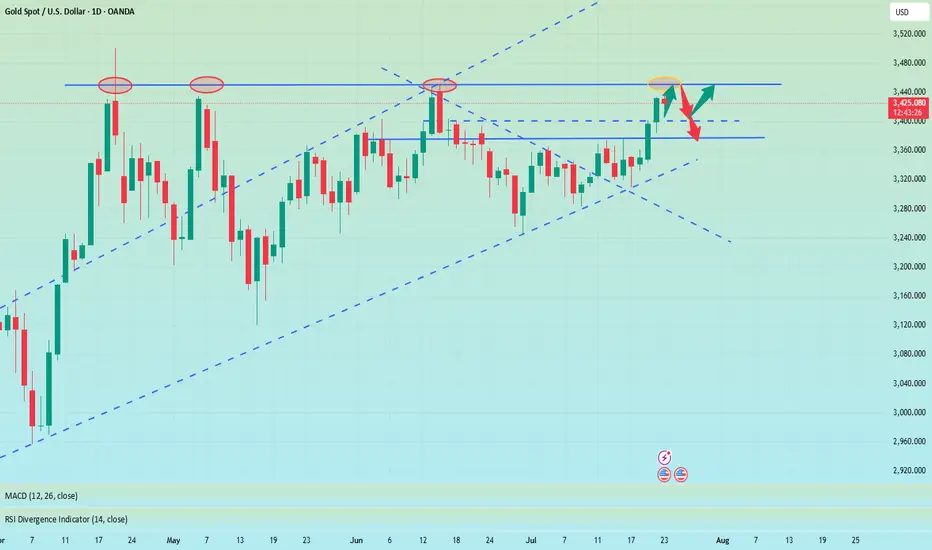
The callback continuity is poor, and the bulls are still strong📰 News information:
1. Geopolitical situation
2. Tariff retaliation
📈 Technical Analysis:
Trump continued to lash out at the Fed, but seemed to have backed off on whether to remove Fed Chairman Powell. The continuous rise of the gold index, once close to 3440, also ushered in a new high in more than a month. Next, we need to pay attention to whether gold can reach the 3450 mark.
Judging from the daily chart, there were three times when it touched around 3450 and then fell back. If it breaks through and stabilizes above 3450 this time, the historical high of 3500 may be refreshed. If it cannot effectively break through 3450, the probability of subsequent retracement is still very high.
From the hourly chart, the bottom support is almost at 3405-3400. However, the recent rhythm belongs to the consolidation of the Asian and European sessions, the US session has begun to rise, and the risk of serious overbought data indicators is still there. This is why I told everyone in the morning that we need to be vigilant about the current rise. Waiting for a pullback to go long is relatively more stable. I also explained in the morning that if it falls below 3405-3400, the decline may continue to around 3385. After all, the fundamental purpose of our trading is to make a profit, so we must minimize the foreseeable risks to the greatest extent possible.
On the whole, if there is an obvious stop-loss signal at 3405-3400, you can consider going long and looking at 3450. Once it falls below 3400, don't chase it easily, and pay attention to the possibility of a retracement below 3385.
🎯 Trading Points:
BUY 3405-3400
TP 3440-3450
In addition to investment, life also includes poetry, distant places, and Allen. Facing the market is actually facing yourself, correcting your shortcomings, facing your mistakes, and exercising strict self-discipline. I share free trading strategies and analysis ideas every day for reference by brothers. I hope my analysis can help you.
FXOPEN:XAUUSD OANDA:XAUUSD FX:XAUUSD FOREXCOM:XAUUSD PEPPERSTONE:XAUUSD TVC:GOLD
Completion of rising wedge Gold is currently still holding rising channel along with the swing moves we were on buy at 3410 and my optimal target was 3425-3430 which is achieved now I'm expecting the reversal move!!
What's possible scanarios we have?
▪️I'm looking for sell opportunity from 3430-3435 area by following our structural strategy, also we have previous moves on Rising channel, market always respect its prevoius BOS and my Selling trade target will be 3405 then 3395 in extension.
▪️if H4 candle closing above 3435-3438 this Parallel moves will be invalid.
