Short gold, Target: 2940-2930Bros, I want to say that 2868 is definitely not the lowest point at the current stage, and the bears have not stopped roaring. After gold falls below 2970, market panic will lead to deep selling, which will drive gold prices further down.
So the bears have not left yet, and any rebound is an opportunity to short gold. As the center of gravity of gold prices moves down, the current resistance has moved down to the 2895-2905 zone again. If gold remains below this area, I think gold is likely to move towards the 2940-2930 zone next!
Bros, profits are the ultimate goal in trading. Accumulating profits is what changes lives and destinies. Choosing wisely is far more important than just working hard. If you want to replicate trade signals and earn stable profits, or if you want to deeply learn the correct trading logic and techniques, you can consider joining the channel at the bottom of this article!
Xauusdtechnicalanalysis

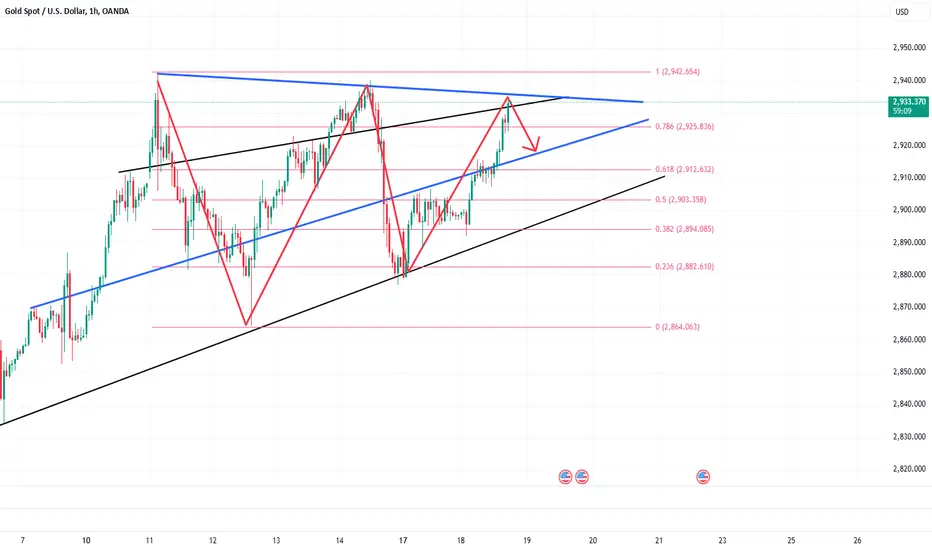
Continue to short gold after the reboundAfter sideways consolidation, gold chose to move downward again, and the current situation and direction are very clear. 2956 has basically been confirmed as the current stage high, so in the New York trading session, we only need to find the right time and point to short gold.
However, although the decline of gold just now was strong, it still seemed a little hesitant when facing the low point last night. There is still a certain support in the intraday, and the gold price will more or less rebound. The resistance area above is the 2915-2925 zone, so I will short gold with the resistance of this area, and gold will definitely touch the 2880-2870 zone or even lower during this round of decline.
Bros, profits are the ultimate goal in trading. Accumulating profits is what changes lives and destinies. Choosing wisely is far more important than just working hard. If you want to replicate trade signals and earn stable profits, or if you want to deeply learn the correct trading logic and techniques, you can consider joining the channel at the bottom of this article!

Any rebound is an opportunity to short goldAs I mentioned in my previous article, after a period of sideways consolidation, gold chose to break downward—signaling greater downside potential. We perfectly captured the shorting opportunity around the 2935-2945 resistance zone. Gold not only successfully hit the 2910-2900 target area but even exceeded my expectations, with the price bottoming out around the 2888 region. This was an excellent short trade, and I personally gained over $10K in profits from this position.
Currently, gold is hovering around the 2890-2888 region, and while the downtrend has momentarily slowed, the bulls have yet to mount any effective counterattack. This indicates weakening bullish sentiment, and with earlier profits being cashed out alongside follow-up and panic-driven selling, the bearish trend is likely far from over. Breaking below the 2890 support further opens the door for continued downward movement, increasing gold’s potential for deeper declines.
For short-term trades, any rebound in gold’s price could present fresh opportunities for short positions. We should closely monitor the 2910-2920 area for potential entries to short gold once again.Bros, profits are the ultimate goal in trading. Accumulating profits is what changes lives and destinies. Choosing wisely is far more important than just working hard. If you want to replicate trade signals and earn stable profits, or if you want to deeply learn the correct trading logic and techniques, you can consider joining the channel at the bottom of this article!

Short gold after reboundWe were fortunate to have closed our long positions around the 2942 level, securing our profits in a timely manner. Although my initial plan was to start shorting gold on Thursday and Friday, the market unexpectedly began its decline earlier than anticipated, and I was unable to open short positions immediately. Given that gold’s downturn started ahead of schedule in this cycle, there is still room for price fluctuations. Therefore, we should avoid rushing into short positions, as gold may still see a short-term rebound to the 2930-2940 region.
Gold has repeatedly faced resistance around the 2950-2955 zone and, following a period of sideways consolidation, finally broke downward—breaching the 2930-2925 support area. This suggests that there is still more downside potential, and the move could trigger panic selling. Consequently, I will be shifting my strategy to prioritize short positions after price rebounds.
For upcoming short-term trades, we can consider initiating short positions in the 2935-2945 zone. Should gold resume its downward trajectory, it is likely to test the 2910-2900 support region.Bros, profits are the ultimate goal in trading. Accumulating profits is what changes lives and destinies. Choosing wisely is far more important than just working hard. If you want to replicate trade signals and earn stable profits, or if you want to deeply learn the correct trading logic and techniques, you can consider joining the channel at the bottom of this article!

Go long on gold in the 2930 area and make continuous profits!Dear Traders,
In the past couple of days, gold has been volatile, swinging up and down. Have you made profits in your gold trades? Regardless, the fluctuations in gold were within my control, and I was able to secure considerable profits from my long gold positions.
As I shared in my previous two articles, in short-term trading, we should avoid hastily chasing rallies in gold. However, once gold retraces to the 2940-2930 support region, we can actively consider going long. Yesterday, after gold retraced to around 2930, it reversed and rebounded, rising to approximately 2953. Today, after touching 2929, gold reversed again and is currently climbing back to around 2942. We've secured substantial profits from two consecutive long trades in gold.
Bros, profits are the ultimate goal in trading. Accumulating profits is what changes lives and destinies. Choosing wisely is far more important than just working hard. If you want to replicate trade signals and earn stable profits, or if you want to deeply learn the correct trading logic and techniques, you can consider joining the channel at the bottom of this article!

XAUUSD H4 :SETUP FOR SWINGHi Guys,
I show you an long setup but please give confirmation in low timeframe and do your own search and do your own-idea .
SecondChanceCrypto
⏰5/JULY/23
⛔️DYOR
Always do your research .
If you have any questions, you can write them in the comments below.and I will answer them.
And please don't forget to support this idea with your likes and comments.

Long gold after a pullbackGold has continued its upward rebound as expected, reaching the 2950-2955 region. However, after hitting this level, there has been no significant pullback, indicating strong upward momentum. This suggests that gold still has potential for further gains and is likely to break the previous high at 2955. Once gold consolidates above the 2955-2950 region during this upward phase, it will likely attempt to reach the 2970-2980 range.
For short-term trading, we should avoid chasing prices too eagerly. Let's patiently wait for a pullback, and once gold retraces to the 2940-2930 support zone, we can consider entering long positions.Bros, are you optimistic about the continuation of gold rebound? If you want to learn more detailed trading ideas and get more trading signals, you can choose to join the channel at the bottom of the article to make trading no longer difficult and make making money a pleasure!

Gold is expected to continue to reach new highs of 2970-2980Dear Traders,
Although gold has slightly retreated after touching around 2948, it is still holding above the 2935-2930 region, maintaining a strong bullish trend.
Based on the current gold structure, gold has repeatedly failed to break the 2920-2925 support zone during its pullback, and has not formed a sustained downtrend. On one hand, this reflects strong buying support at lower levels; on the other hand, the pullback space is limited. Therefore, before any trend reversal, gold is likely to have another rally to test new highs. I expect that if gold manages to hold above the 2950-2955 region in this rally, it will likely attempt to reach the 2970-2980 zone.
So, for short-term trading, leading into Thursday and Friday, we should primarily focus on going long on gold, with key support around the 2940-2930 region. If gold reaches the 2970-2980 region, we can then consider shorting it.
Bros, are you optimistic about gold continuing to hit new highs? Do you know how to grasp the trading rhythm? If you want to learn more detailed trading ideas and get more trading signals, you can choose to join the channel at the bottom of the article to make trading no longer difficult and make making money a pleasure!

GOLD (XAUUSD): One More Consolidation
Since Wednesday, Gold started to consolidate within a horizontal
channel on a 4H.
To buy Gold with a confirmation next week, wait for a breakout of
the resistance of the channel. It will initiate a movement higher at least to 2975.
Alternatively, a bearish breakout of a support of the channel can trigger
a local correctional movement at least to 2906.
Wait for a breakout, it will provide a reliable confirmation.
❤️Please, support my work with like, thank you!❤️

Be bold and short goldBrothers, did you short gold?
As I mentioned in my previous article, I have already entered short positions in the 2930-2940 zone. Today, gold has broken below Wednesday’s low, which has to some extent opened further downside potential and strengthened the probability of continued decline. Moreover, under the pressure of the head and shoulders pattern, I believe gold is highly likely to retest the 2920-2910 support zone today.
I have followed my trading plan and am currently in profit on my short positions. We can continue to hold and wait for further profit expansion. Did you follow me in shorting gold?If you want to learn more detailed trading ideas and get more trading signals, you can choose to join the channel at the bottom of the article to make trading no longer difficult and make making money a pleasure!

Keep making money by shorting goldYesterday, I remained firmly committed to shorting gold from start to finish, and as anticipated, gold retraced to my two target zones: 2930-2925 and 2920-2910.
Today, gold has pulled back to around 2916, breaking Wednesday’s low, which has, to some extent, opened up downside potential and strengthened expectations for further downside acceleration toward the 2900-2880 region. Additionally, from a short-term technical perspective, a head and shoulders pattern has formed, further supporting the likelihood of a sharper decline. Therefore, in today’s trading, I continue to favor short positions in gold.
As gold’s price action shifts lower, overhead resistance levels are also adjusting downward. This calls for a more conservative expectation of gold’s rebound potential. For short-term trading, we can consider scaling into short positions in the 2930-2940 zone.
Bros, are you optimistic about the continued decline of gold? If you want to learn more detailed trading ideas and get more trading signals, you can choose to join the channel at the bottom of the article to make trading no longer difficult and make making money a pleasure!

Short gold againAs I mentioned in my previous article, I anticipated that gold might pull back to the 2930-2925 region, or even extend to the 2910 region, during today or tomorrow's New York trading session. Clearly, gold has retraced as expected and hit my target zone of 2930-2925. Our short position around 2954 has once again yielded a very favorable profit, totaling 270 pips.
Currently, gold has experienced a slight rebound, but it’s evident that the bullish momentum is weakening while bearish control is strengthening. After the accelerated short squeeze phase, 2955 may become the high for this stage. Moreover, as geopolitical risks decrease, the bullish momentum for gold further weakens, making it likely that gold could further dip and test the 2920-2910 support zone.
Therefore, for current short-term trading, I believe it might be a good idea to consider shorting gold again in the 2935-2940 region.Bros, will you follow me and short gold again? If you want to learn more detailed trading ideas and get more trading signals, you can choose to join the channel at the bottom of the article to make trading no longer difficult and make making money a pleasure!

Sorry, I'm shorting gold againYesterday, gold retraced to a low near 2919, but it didn’t reach my expected target zone of 2915-2910, so I didn’t have the opportunity to go long on gold. Currently, gold has rebounded again and extended above 2950. To be honest, while gold maintains its strong bullish position, as long as it stays above 2930, I still don’t recommend chasing long positions. With gold currently trading near 2954, I am even less inclined to go long.
On the contrary, the accelerated rally in gold has a short squeeze potential, so at this level, I am more inclined to short gold. From a cyclical perspective, gold has been prone to showing “Black Thursday” and “Black Friday” patterns recently, so there is a possibility that a reversal could occur today or tomorrow. Therefore, I still recommend continuing to try shorting gold in the short term.
I tend to think that gold may pull back to the 2930-2925 area during the New York trading session today or tomorrow, and may even extend to the area around 2910.Bros, have you followed me to do more gold? If you want to learn more detailed trading ideas and get more trading signals, you can choose to join the channel at the bottom of the article to make trading no longer difficult and make making money a pleasure!

What to do if you hold a short position?Dear Traders,
Gold has continued its upward movement, supported by strong buying interest, pushing above 2930, with bullish momentum regaining control. However, at this stage, I do not believe it is wise to chase further long positions in gold.
I am currently still holding short positions in gold, and despite its apparent strength, I am not concerned about my short positions. This is because gold is once again facing resistance at previous highs, and according to the trendline, the 2936-2940 region remains a key resistance zone. Therefore, it is likely that gold will pull back upon reaching this zone and test support in the 2915-2910 region.
In terms of short-term trading, I will continue to short gold in batches above 2930, using the 2936-2940 resistance zone, and expect a retracement towards the 2915 area.
Bros, do you have the courage to short gold with me? If you want to learn more detailed trading ideas and get more trading signals, you can choose to join the channel at the bottom of the article to make trading no longer difficult and make making money a pleasure!
#GOLD - one n single support, hold or not??#GOLD.. perfectly retrace from our expected area 2880-85
And now market holding his current supporting area that is around 2863-64
Keep close it guys because that area is our current supporting area and only holding of that area can create again buying volume otherwise below that we will go for a cut n reverse on confirmation.
Stay sharp..
Good luck
Trade wisely

GOLD (XAUUSD): Support & Resistance Levels For Next Week
Here is my latest structure analysis for Gold for next week.
Vertical Structures
Vertical Support 1: Rising Trend Line
Horizontal Structures
Resistance 1: 2786 - 2790 area
Support 1: 2718 - 2732 area
Support 2: 2689 - 2698 area
Support 3: 2655 - 2663 area
Support 4: 2614 - 2635 area
Support 5: 2596 - 2605 area
Support 6: 2583 - 2585 area
Consider these structures for pulback/breakout trading.
❤️Please, support my work with like, thank you!❤️

GOLD (XAUUSD) Support & Resistance Analysis For Next Week
Here is my latest structure analysis for Gold for next week.
Support 1: 2546 - 2560 area
Support 2: 2524 - 2530 area
Support 3: 2470 - 2485 area
Support 4: 2432 - 2448 area
Support 5: 2352 - 2381 area
Resistance 1: 2643 - 2659 area
Resistance 2: 2705 - 2733 area
Resistance 3: 2786 - 2790 area
Consider these structures for pullback/breakout trading.
❤️Please, support my work with like, thank you!❤️

GOLD (XAUUSD): Your Trading Plan Ahead of FED
Ahead of FED Powell Speech today, Gold finally stopped falling.
For now, a key daily support that the price tested earlier holds.
To catch a pullback trade from that, pay attention to an inverted
cup & handle pattern on an hourly time frame.
Wait for a bullish breakout of its neckline - an hourly candle close above
that will give you a strong bullish signal.
A pullback will be excepted at least to 2580 level then.
Alternatively, a daily candle close below the underlined daily support
will be a strong bearish signal.
❤️Please, support my work with like, thank you!❤️

XAUUSD I Technical Analysis & Trading PlanWelcome back! Let me know your thoughts in the comments!
** XAUUSD Analysis - Listen to video!
We recommend that you keep this pair on your watchlist and enter when the entry criteria of your strategy is met.
Please support this idea with a LIKE and COMMENT if you find it useful and Click "Follow" on our profile if you'd like these trade ideas delivered straight to your email in the future.
Thanks for your continued support!Welcome back! Let me know your thoughts in the comments!

GOLD (XAUUSD): Detailed Support & Resistance Analysis
Here is my latest structure analysis and important
support and resistance levels to pay close attention to on Gold.
Vertical Structures
Vertical Resistance 1: Rising Trend Line
Horizontal Structures
Support 1: 2470 - 2484 area
Support 2: 2431 - 2448 area
Support 3: 2364 - 2381 area
Resistance 1: 2517 - 2532 area
Resistance 2: 2545 - 2552 area
Consider these structures for pullback/breakout trading.
❤️Please, support my work with like, thank you!❤️

XAUUSD I Do not SHORT too soon! Welcome back! Let me know your thoughts in the comments!
** XAUUSD Analysis - Listen to video!
We recommend that you keep this pair on your watchlist and enter when the entry criteria of your strategy is met.
Please support this idea with a LIKE and COMMENT if you find it useful and Click "Follow" on our profile if you'd like these trade ideas delivered straight to your email in the future.
Thanks for your continued support!Welcome back! Let me know your thoughts in the comments!

XAUUSD | GOLDSPOT | New perspective | follow-up detail [22 - 26]Gold prices took a tumble on Friday, dropping over 2% as the US Dollar strengthened and investors took profits after last week's record highs. The precious metal extended its losing streak to three days, closing around the $2,400 level.
What drove the dip?
📈 Strong US Dollar: A surge in the USD, fueled by speculation about a Republican victory in the US elections, weighed on gold.
📈 Rising Bond Yields: Increasing bond yields also contributed to the decline, making gold less attractive.
But hold on, the story doesn't end there! 🤔
Analysts remain optimistic about gold's long-term prospects:
📉 Fed Rate Cuts: The Federal Reserve is expected to cut interest rates in September, which is bullish for gold.
📈 Market Sentiment: According to the CME FedWatch Tool, markets are pricing in a 98% chance of a U.S. rate cut in September.
🌎 Geopolitical Instability & Central Bank Demand: Ongoing global tensions and central bank buying provide further support for the precious metal.
🔍 What's Next?
Gold prices took a hit last week, but is this just a temporary dip or a sign of things to come? This video dives deep into the technical aspects of XAUUSD, offering insights into what to expect in the coming week!
Don't miss out on this comprehensive analysis!
XAUUSD Technical Overview:
This week, we're focusing on the crucial $2,400 level. This is a big deal for gold traders - it could be a make-or-break point. If gold stays above $2,400: Bulls might take control, potentially pushing prices higher and setting up new highs. If gold falls below $2,400: Bears might gain the upper hand, and prices could head south. Join me as we explore these factors and potential opportunities in the gold market. Like, subscribe, and hit the notification bell for the latest analysis and insights!
#GoldAnalysis #ForexTrading #GoldMarket #FederalReserve #TradingStrategy #MarketInsights #USYields #InflationData #EmploymentData #FinancialMarkets #GoldPrice #Investing #TradingTips #ForexEducation #TrumpPolicies #JeromePowell #GeopoliticalStability #CentralBankDemand 📺🔔💼
Disclaimer Notice:
Trading in the foreign exchange market and other instruments carries a high risk and may not be suitable for all investors. The content provided here is for educational purposes only. Evaluate your financial situation and consult with a financial advisor before making any investment decisions. Past performance is not indicative of future results.

XAUUSD | GOLDSPOT | New perspective | follow-up detailsIn the latest global events, Gold has soared to new heights, hitting a five-day peak above $2,400 fueled by escalating tensions between Israel and Iran. Investors sought refuge in the non-interest-yielding asset as uncertainty loomed, driving prices to a weekly high of $2,417 per ounce. However, the rally proved fleeting as Iran quashed fears of immediate retaliation.
Meanwhile, US front, robust US Retail Sales figures from last week triggered a reevaluation of interest rate expectations, propelling the US 10-year note yield to levels not seen since November 2023, reaching a peak of 4.696%. Atlanta Fed’s Raphael Bostic cautioned against persistently high inflation, signalling a challenging path ahead for the central bank. Yet, New York Fed President John Williams struck a more measured tone, highlighting the Fed's data-driven approach and its current stance on monetary policy.
As market sentiment fluctuates, the CME FedWatch Tool hints at a shift in sentiment for potential rate cuts, with September earmarked as a likely window for action. Against this backdrop, this video delves into the technical intricacies of the XAUUSD chart. Through the lens of price action analysis, we unravel the behavioural patterns driving market dynamics and offer insight into potential price movements for the week ahead.
XAUUSD Technical Overview:
In this video, we conducted a thorough analysis of the XAUUSD chart, integrating both technical and fundamental perspectives. Our analysis delved into key levels, historical price movements, market dynamics, and the interaction between buyers and sellers, intending to identify potential trading opportunities.
Our focus for the upcoming week centres around the $2,365 zone, which holds significant historical importance and is poised to influence next week's trading activity significantly. Sustained bullish momentum above this level could fuel continued buying interest, potentially driving prices to new highs. Conversely, a breach below the $2,365 level, accompanied by ongoing selling pressure, may indicate a resurgence of bearish sentiment.
#GoldMarket #SafeHavenAssets 📺🔔💼
Disclaimer Notice:
Please be aware that margin trading in the foreign exchange market, including commodity trading, CFDs, stocks, and other instruments, carries a high level of risk and may not be suitable for all investors. The content of this speculative material, including all data, is provided by me for educational purposes only and to assist in making independent investment decisions. All information presented here is for reference purposes only, and I do not assume any responsibility for its accuracy.
It is important that you carefully evaluate your investment experience, financial situation, investment objectives, and risk tolerance level. Before making any investment, it is advisable to consult with your independent financial advisor to assess the suitability of your circumstances.
Please note that I cannot guarantee the accuracy of the information provided, and I am not liable for any loss or damage that may directly or indirectly result from the content or the receipt of any instructions or notifications associated with it.
Remember that past performance is not necessarily indicative of future results. Keep this in mind while considering any investment opportunities.

GOLD (XAUUSD): Important Key Levels & Structure Analysis 🥇
Here is my latest structure analysis for Gold.
Vertical Structures
Vertical Support 1: Rising trend line
Horizontal Structures
Horizontal Support 1: 2009 - 2014 area
Horizontal Support 2: 2001 - 2006 area
Horizontal Support 3: 1965 - 1977 area
Horizontal Resistance 1: 2055 - 2065 area
Horizontal Resistance 2: 2077 - 2088 area
Consider these structures for pullback/breakout trading.
❤️Please, support my work with like, thank you!❤️
