Long XOM - Retesting it's breakout level
Just an idea, but has sub 15 p/e and should be extra profitable this year..
XOM

XOM bear call vertical for 4/8XOM seems to be having a hard time getting going bullish, so I'd look for continued downside. Not hugely bearish but doesn't seem like it wasn't to go to the upside; for now. Snagging a bear call vertical for 4/8 at 82/85.

XOM bullishI have been showing many positions with bearish direction recently. This position is meant to be a hedge to many of those, and this is one of the very few I could find that look really good bullish. So going to do the Apr 1 84/86 bull call vert. I like the trade a lot but it is mostly to offset many of the shorts I have open, so I am making this position larger than normal.


ENSV and Oil, Up Up and Away?I'm still researching, i.e. justifying my bag holding, XOM and NINE have both had good surprises for their earning reports. We'll keep an eye on the rest of the sector as they have earnings reported, but I suspect they are all going to be good surprises for a big win in the next week or two.

EXXON MOBIL CORPORATION show very good bullish signalEXXON MOBIL CORPORATION show very good bullish signal, if we break the resistance line, there is a high probability of the continuation of the trend.

3/13/22 XOMExxon Mobil Corporation ( NYSE:XOM )
Sector: Energy Minerals (Integrated Oil)
Market Capitalization: $359.517B
Current Price: $84.92
Breakout price: $83.00 (hold above)
Buy Zone (Top/Bottom Range): $82.90-$77.15
Price Target: $85.00-$86.20 (Reached), $98.00-$100.00 (2nd)
Estimated Duration to Target: 50-52d
Contract of Interest: $XOM 6/17/22 105c
Trade price as of publish date: $1.25/contract

XOM - 1D Long Signal💡💡#SIGNAL 💡💡
$XOM
▶️ Buy NOW + Block
🔴 SLT - 1D (Trigger)
#XOM_1D_070322
Due to the conflict between Russia and Ukraine, a significant increase in oil and gas prices is expected.

Shorting Exxon. XOMGoals 73, 72, 70. Invalidation at 88.
We are not in the business of getting every prediction right, no one ever does and that is not the aim of the game. The Fibonacci targets are highlighted in purple with invalidation in red. Fibonacci goals, it is prudent to suggest, are nothing more than mere fractally evident and therefore statistically likely levels that the market will go to. Having said that, the market will always do what it wants and always has a mind of its own. Therefore, none of this is financial advice, so do your own research and rely only on your own analysis. Trading is a true one man sport. Good luck out there and stay safe

XOM coming in hot!$XOM coming in as a hot commodity right now, with the possibility of banning Russian oil in the US and other allied countries.
left the other oil producers to be on the hot list for possible back up producer to counter the banning. for the people who doesn't know,
Russia is the 3rd largest oil and natural gas producer in the world. with the banning being imposed, this will take a toll on most countries
who relied on Russian oil and gas making a possible world wide shortage of oil and natural gas if the other oil producer can't keep up.
Day trade or scalp target play: 03/ 08 /22
Buy call above 85.06 sell at 86.36
Buy puts below 83.67 sell at 81.74
Hello everyone,
welcome to this free technical analysis . ( mostly momentum play )
I am going to explain where I think this stock is going to go over the next day or week play and where I would look for trading opportunities
for day trades or scalp play.
If you have any questions or suggestions which stock I should analyze, please leave a comment below.
If you enjoyed this analysis, I would definitely appreciate it, if you smash that LIKE button and maybe consider following my channel.
Thank you for stopping by and stay tune for more.
My technical analysis is not to be regarded as investment advice. but for general informational proposes only.

Exposure to Flying oil prices..!Entry: The market opening price
Stop loss: 74
Reward/Risk: 2-2.3
Target range: 105
Time Frame: 4-12 wks
Possible gain: 20-25%
Possible loss: 10-12%%
Position size: 5% of trading capital
You can see the most important support(green line) and resistance (red line) levels.
Best,
Dr. Moshkelgosha M.D
DISCLAIMER
I’m not a certified financial planner/advisor, a certified financial analyst, an economist, a CPA, an accountant, or a lawyer. I’m not a finance professional through formal education. The contents on this site are for informational purposes only and do not constitute financial, accounting, or legal advice. I can’t promise that the information shared on my posts is appropriate for you or anyone else. By using this site, you agree to hold me harmless from any ramifications, financial or otherwise, that occur to you as a result of acting on information found on this site.

$XOM hot commodity!$XOM has been one of the hot commodity for the past the few months. gas prices keeps surging up and up due to various reasons.
for now, oil started to cool down after hitting the ATH and continues trend lower below ema line for the past few days
for momentum move. although its started to pulls back, there's a possibilities that it might bounce back up due to war conflict
between the two countries Ukraine and Russia. once the war is officially started the oil might start move again due to possible high demand.
overall, the market is still very bearish and specially the tech market. please trade cautiously.
Day trade or scalp target play: 02/22/22
Buy call above 76.90 sell at 78.90
Buy puts below 76.10 sell at 75.31
Hello everyone,
welcome to this free technical analysis . ( mostly momentum play )
I am going to explain where I think this stock is going to go over the next day or week play and where I would look for trading opportunities
for day trades or scalp play.
If you have any questions or suggestions which stock I should analyze, please leave a comment below.
If you enjoyed this analysis, I would definitely appreciate it, if you smash that LIKE button and maybe consider following my channel.
Thank you for stopping by and stay tune for more.
My technical analysis is not to be regarded as investment advice. but for general informational proposes only.

Exxon ~ XOMExxon let's watch for a short with a LIS at 81.
This one has lots of resistance around 80.
XOM- USO oil overdone!The oil trade has the masses crowding the same trades banks and energy up 26% in 5 weeks. Considering the economic data, the start of a bear market, slowing economy, possible rate hikes and the shift to EV oil got way ahead of itself and I would expect a 12-15% correction in the coming weeks. Some would look at this chart and call a breakout, I think an 8 year high in oil going into a slowing economy is reminiscent of 2008 when oil hit $151 intraday was a blowoff top, the same time Goldman Sachs was pounding the table predicting $250 a barrel oil, within a couple months later oil hit $35. I think as usual the crowd is wrong here and I am usually a contrarian on everything! BTW, Feb 9th is XOM ex-dividend date so likely the stock will remain artificially elevated until then. GL

CVX - Entering resistance zoneEVERYONE including me are bullish with Oil sector but I think the sector is facing a significant resistance zone ahead and I am locking in my profit.

XOM 3-2-2 continuation? XOM had a beautiful Friday. The rev strat setup was lovely and it pushed immediately. Energy has been doing well, so I think it's still on watch. Possible corrective activity, or just a continuous push. If you can catch the bounce, trade it back into FTFC. Can play this both ways or just watch for the move.

$XOM update $XOM update
——————
I am not your financial advisor, but I will happily answer questions and analyze to the best of my ability but ultimately the risk is on you. Check out my ideas, but also do your own due diligence.
I have a huge tolerance for volatility so please know that. If you’re new to my trade setups please try them on a small scale first. Then go in with a risk you’re comfortable with.
I am not a bull. I am not a bear. I just see what I see in the charts and I don’t pay too much attention to the noise in the news.
If you want me to analyze any stock or ETF just leave me a comment and I’ll do it if I can. (If I have time)
And most importantly… Have fun, y’all!!
(\_/)
( •_•)
/ >🚀

$XOM Short - OverboughtXOM looks over extended and approaching heavy resistance after ER pop.
I like the short setup here with MARCH 80 puts opened today, looking for some retracement / pullback expected to cool off the RSI. This isn't a long term idea, just to profit off the expected profit taking that's expected after such a strong move to the upside.
First target is $77.5

XOM Exxon Mobil Net-Zero Greenhouse Gas Emission | Price TargetsToday i have 2 relevant price targets for your from the most prestigious analysts: The Goldman Sachs Group prediction is $83 for XOM, which is most likely (to hit the resistance level) and Bank of America which has an optimistic price target of $95.
The price targets are plausible, since there is a possible disruption to European energy supplies because of Russia - Ukraine border crisis.
and
Crude oil prices will likely stay at the 7 year high since OPEC+ will keep the existing policy of gradual increase of production.
XOM will spend $3bn in the next five years on a new low-carbon business unit. They also bought a 49.9% stake in Norwegian biofuels company Biojet AS to achieve its target for reducing greenhouse gas emissions.
Exxon Goal for 2050 is Net-Zero Greenhouse Gas Emissions.
Exxon Mobil haven`t cut the dividends, like other companies, even though in 2020 they had negative earnings, -22.44Bil.
Looking forward to read your opinion about it.

1/30/22 XOMExxon Mobil Corporation ( NYSE:XOM )
Sector: Energy Minerals (Integrated Oil)
Market Capitalization: 318.703B
Current Price: $75.28
Breakout price: $76.05
Buy Zone (Top/Bottom Range): $73.90-$69.90
Price Target: $85.00-$86.20
Estimated Duration to Target: 112-120d
Contract of Interest: $XOM 6/17/22 75c
Trade price as of publish date: $5.05/contract

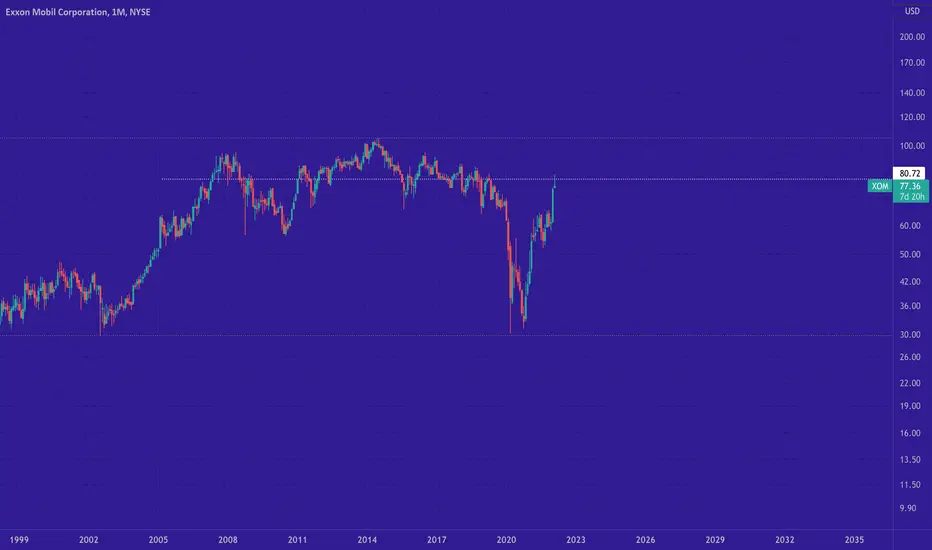
$XOM bullish break above long 7.5 year trendline on monthly$XOM bullish break above long 7.5 year trendline
And on the weekly looking like a golden cross (w/ my 35 & 180EMA’s which are quite reliable)
No trade plan right now, just an observation… I sold at 70.83 on the last swing but will add this one to my radar of things that could stay bullish. Energy stocks $XLE (SPDR Energy Sector ETF will be on my list as well)
Definitely a bullish move and I’ll be looking on the smaller timeframes for a possible entry…
Though, also noting, that in the last financial crisis XOM did decline as well, so that trendline will be watched carefully…
——————
I am not your financial advisor, but I will happily answer questions and analyze to the best of my ability but ultimately the risk is on you. Check out my ideas, but also do your own due diligence.
I am not a bull. I am not a bear. I just see what I see in the charts and I don’t pay too much attention to the noise in the news.
If you want me to analyze any stock or ETF just leave me a comment and I’ll do it if I can. (If I have time)
Have fun, y’all!!
(\_/)
( •_•)
/ >🚀

EXXON Mobil is putting a smile on our faces. XOMConfirm on Wave C, we are going up. Markets cannot be timed, but we estimate this is a more or less longterm prediction.
We are not in the business of getting every prediction right, no one ever does and that is not the aim of the game. The Fibonacci targets are highlighted in green with invalidation in red. Fibonacci goals, it is prudent to suggest, are nothing more than mere fractally evident and therefore statistically likely levels that the market will go to. Having said that, the market will always do what it wants and always has a mind of its own. Therefore, none of this is financial advice, so do your own research and rely only on your own analysis. Trading is a true one man sport. Good luck out there and stay safe!

XOM - Remains a Strong Longterm Buy $XOM - I expect to top around 86-94ish with selling to step back in at this middle channel line. Expected pull back around 53-61.15. Overall, #XOM still looks like a great long opportunity into 150-200 Long Term.
