DOW JONES / US30There is a possibility of price correction from the range of 38903.71 towards 39915 and it can be entered as a trade.
YM1

DOW fulfilled all Market Bottom conditions. 2year rally started!Dow Jones (DJI) has cemented a strong Support zone last week. Not only did it almost test its 1W MA200 (orange trend-line) and successfully held but also the former All Time High (ATH) Resistance trend-line that started from the previous Cycle Top and now turned into Support.
This previous ATH trend-line held and offered its Support on the previous 2 major market bottoms as well (October 03 2022 and March 23 2020). Actually on all 3 previous Cycle bottoms that turned out to be the best level to buy long-term, the 1W RSI was oversold on the 30.00 limit.
All the above conditions were fulfilled on last week's (April 07 2025) Low. Even though Dow is expected to reach 53000 on its next Top in around 2 years, the most optimal Sell Signal has been given by the 1W RSI. After the 1W RSI breaks for the first time above the 70.00 overbought limit again, the best Sell Signal would be after it drops and re-tests again 70.00 for the 2nd time.
-------------------------------------------------------------------------------
** Please LIKE 👍, FOLLOW ✅, SHARE 🙌 and COMMENT ✍ if you enjoy this idea! Also share your ideas and charts in the comments section below! This is best way to keep it relevant, support us, keep the content here free and allow the idea to reach as many people as possible. **
-------------------------------------------------------------------------------
Disclosure: I am part of Trade Nation's Influencer program and receive a monthly fee for using their TradingView charts in my analysis.
💸💸💸💸💸💸
👇 👇 👇 👇 👇 👇

Daily Price Action: Futures Dow Jones YM1! Tuesday 4/15/2025In this video, we are looking into the potential daily price action of YM1!.

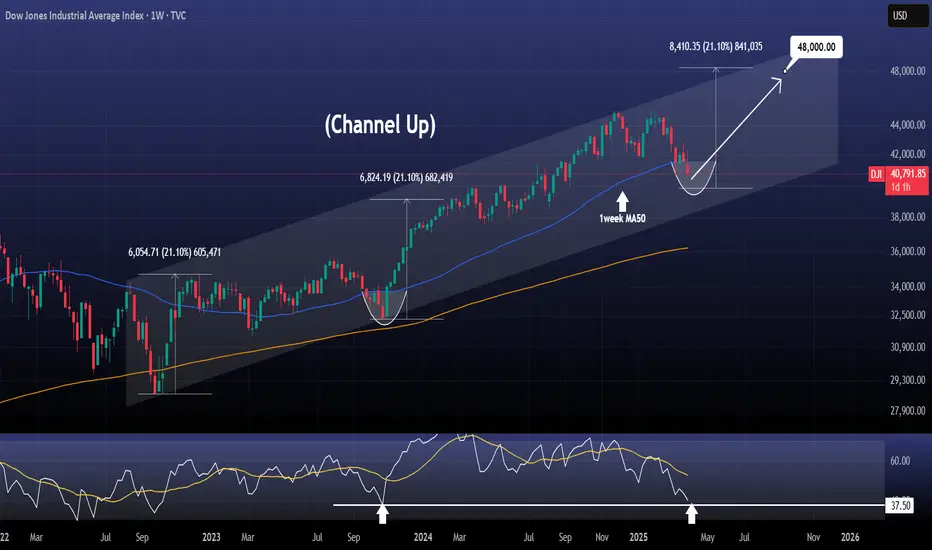
DOW JONES: Starting the final stage of 3year Bull Cycle.Dow Jones got oversold on its 1D technical outlook (RSI = 29.297, MACD = -550.130, ADX = 76.606) as it is currently testing its 1W MA50. This is a level that has been intact since November 2023 and is of high importance to the trend as it has a key cyclical attribute. The driving growth pattern of Dow since the 2009 bottom is a Channel Up and every time a Bull Cycle starts, the 1W MA50 is the first level of support, with every touch of it being the strongest buy opportunity. When the 3 year Bull Cycle is coming to an end, the 1W MA50 breaks and the index approaches the 1M MA50 during its Bear Cycle correction, which becomes the ultimate buy entry for the new long term 3 year Bull Cycle.
The current Cycle should starts getting completed technically after September 2025, so there is a high chance that the 1W MA50 holds here. The three Bull Cycles we've had so far had a fairly similar growth percentage, rising by +70.38% to +76.64%. If the +70.38% minimum range is followed on the current (4th) Bull Cycle, then we're aiming at 48,000 (TP) towards the end of the year. The 1M CCI seems to be printing the exact same build up to the Bear Cycle as in the past.
## If you like our free content follow our profile to get more daily ideas. ##
## Comments and likes are greatly appreciated. ##

Weekly Market Forecast: Stocks Markets Could Push Higher!In this video, we will analyze the S&P 500, NASDAQ, and DOW JONES futures for the week of April 14-18th.
The Stock Market Indices ended a turbulent week on a bullish note, and next week could see some continuation. The markets have peeked above the consolidation, and could be on the way to resume the overall bullish trend.
Wait for confirmations of the trend before jumping in! One bad report of tariffs or geo-political news can turn the markets down at any time.
Enjoy!
May profits be upon you.
Leave any questions or comments in the comment section.
I appreciate any feedback from my viewers!
Like and/or subscribe if you want more accurate analysis.
Thank you so much!
Disclaimer:
I do not provide personal investment advice and I am not a qualified licensed investment advisor.
All information found here, including any ideas, opinions, views, predictions, forecasts, commentaries, suggestions, expressed or implied herein, are for informational, entertainment or educational purposes only and should not be construed as personal investment advice. While the information provided is believed to be accurate, it may include errors or inaccuracies.
I will not and cannot be held liable for any actions you take as a result of anything you read here.
Conduct your own due diligence, or consult a licensed financial advisor or broker before making any and all investment decisions. Any investments, trades, speculations, or decisions made on the basis of any information found on this channel, expressed or implied herein, are committed at your own risk, financial or otherwise.

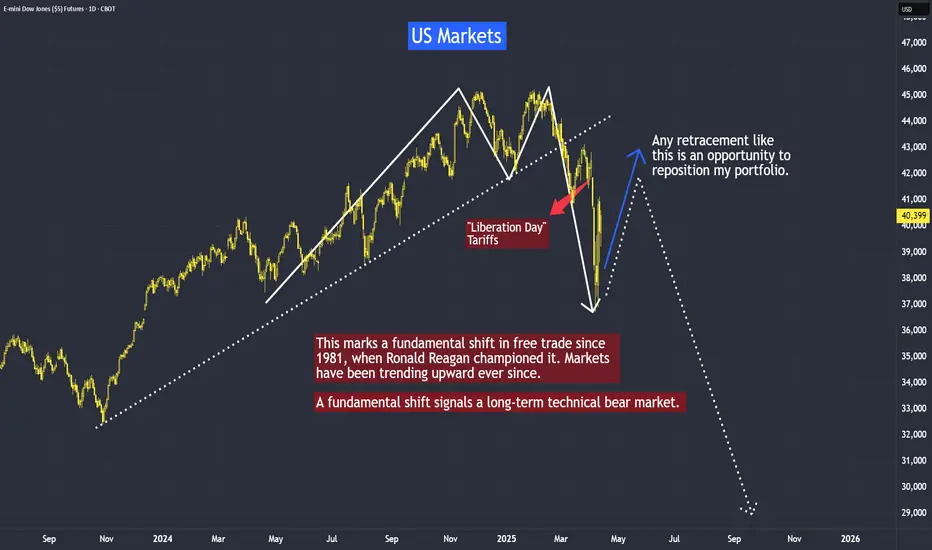
A Fundamental Shift Signals a Long-Term Technical Bear MarketE-mini Dow Jones Index Futures & Options
Ticker: YM
Minimum fluctuation:
1.00 index point = $5.00
Micro E-mini Dow Jones Index Futures
Ticker: MYM
Minimum fluctuation:
1.0 index points = $0.50
Disclaimer:
• What presented here is not a recommendation, please consult your licensed broker.
• Our mission is to create lateral thinking skills for every investor and trader, knowing when to take a calculated risk with market uncertainty and a bolder risk when opportunity arises.
CME Real-time Market Data help identify trading set-ups in real-time and express my market views. If you have futures in your trading portfolio, you can check out on CME Group data plans available that suit your trading needs tradingview.com/cme/
Trading the Micro: cmegroup.com/markets/microsuite.html
DOW JONES: Just triggered the most historic buy signal (1M MA50)Despite the bearishness on the lower timeframes, Dow is neutral on the ultimate long term chart, the 1M (RSI = 51.044, MACD = 1991.530, ADX = 44.038) and that is due to the fact it almost touched its 1M MA50. This neutral technical setting is a great reset for the Channel Up and stands as the most ideal long term buy entry and was tested before on all 4 major market bottoms (September 2022, March 2020, January 2016, October 2011). In all incidents it set in motion the new Bull Cycle, technically the bullish wave of the Channel Up. The most common price increase is +70% and along those lines, we anticipate Dow to hit 60,000 by the end of 2027.
## If you like our free content follow our profile to get more daily ideas. ##
## Comments and likes are greatly appreciated. ##

DOW JONES: High volatility but clear picture long term.Dow Jones turned bearish on its 1D technical outlook (RSI = 40.021, MACD = -1063.380, ADX = 32.380) as it is correcting brutally yesterday's gains on uncertainty regarding the 90-day pause of tariffs. We can't overlook however the fact that yesterday's rebound happened on the 1W MA200 and at the bottom (HL) of the Bullish Megaphone. The very same sequence of events unfolded during the last big U.S.-China trade war that bottomed in December 2018. First a Channel Down bottomed on the 1W MA200 and started the Bullish Megaphone that bottomed on the 2018 trade war.
Both trade war corrections were -19% and if what follows replicates the 2019 rise, then we are up for a +35% rally. Potential TP = 49,000.
## If you like our free content follow our profile to get more daily ideas. ##
## Comments and likes are greatly appreciated. ##

DOW 104% TARIFFS on China activated. Can the market be saved?Dow Jones (DJIA) is almost on its 1W MA200 (orange trend-line) and earlier today President Trump activated 104% duties on Chinese imports. This is far from being an encouraging development especially after Monday's attempt for the market to recover.
Most of the gains were lost yesterday and today it is a wait-and-see game in anticipation of the market reaction on the opening bell of Wall Street.
From a long-term technical perspective however, Dow is on a huge buy level that we've only seen another 4 times since the Housing Bubble bottom in March 2009. That buy level consists of two conditions: price touching the 1W MA200 and the 1W RSI hits (or comes extremely close to) the 30.00 oversold limit.
As you can see that has happened last time on September 19 2022 (Inflation Crisis bottom), March 09 2020 (COVID crash), August 24 2015 (China slowdown, Grexit) and August 08 2011 (first correction since 2009 Housing Crisis). The situation most similar to the current, is the COVID crash as it was the fastest drop to the 1W MA200 and 1W RSI to 30.00.
Despite the brutal correction, it took the market 'only' 43 weeks (301 days) to reach again the 0.786 Fibonacci retracement level. That is the top of the Blue Zone of the Fibonacci Channel Up that started on the March 2009 Housing bottom. The Blue Zone, consisting of the 0.786 - 0.382 Fib range, is important as it has dominated the multi-year bullish trend and contained the price action inside it, with only a few occasions diverging outside of it.
The longest it took Dow to reach the 0.786 Fib again after such correction was 110 weeks (770 days) and that interestingly enough happened two out of the four times. Practically reaching the 0.786 Fib constitutes a Cycle Top.
So essentially, despite the uncertainty and panic, the market is technically on a Support level that in 16 years we've only seen another 4 times, that's once every 4 years, which is a fair sample of a Cycle size. As a result, assuming stability comes to the world through trade deals (and why not Rate Cut announcements), we may see Dow reaching its 0.786 Fib again (and make new ATH) the fastest by February 02 2026, hitting 49000 and the longest by May 17 2027, hitting 56000 roughly.
-------------------------------------------------------------------------------
** Please LIKE 👍, FOLLOW ✅, SHARE 🙌 and COMMENT ✍ if you enjoy this idea! Also share your ideas and charts in the comments section below! This is best way to keep it relevant, support us, keep the content here free and allow the idea to reach as many people as possible. **
-------------------------------------------------------------------------------
💸💸💸💸💸💸
👇 👇 👇 👇 👇 👇

DOW JONES Will the 1week MA200 save the day?Dow Jones / US30 almost reached its 1week MA200 today and immediately rebounded.
Last time it approached it so closely was on October 23rd 2023 and last it crossed under it was September 19th 2022.
The most recent was the first higher low of the 3 year Channel Up and the latter was the bottom of the last bear market.
The 1week RSI hasn't been this low since June 13th 2022, which was again a near 1week MA200 test that caused an immediate rebound to the 1week MA50 before the rejection to the eventual bear market bottom.
As long as the 1week MA200 holds and closes the candles over it, we expect the Channel Up to start a near bullish wave like post October 2023.
Target 45200 (same as the March 2024 rally) which is around the All Time High.
Follow us, like the idea and leave a comment below!!

Weekly Market Forecast: Short Term Buys, Then Sells! In this video, we will analyze the S&P 500, NASDAQ, AND DOW JONES Futures for the week of April 7 - 11th.
The Stock Market Indices may find support at current levels for a Bear Market Rally. Wait for the market structure shift to the upside before taking any buys. Let the market confirm it's intended direction first, then look for valid buy setups for a short term countertrend play.
Enjoy!
May profits be upon you.
Leave any questions or comments in the comment section.
I appreciate any feedback from my viewers!
Like and/or subscribe if you want more accurate analysis.
Thank you so much!
Disclaimer:
I do not provide personal investment advice and I am not a qualified licensed investment advisor.
All information found here, including any ideas, opinions, views, predictions, forecasts, commentaries, suggestions, expressed or implied herein, are for informational, entertainment or educational purposes only and should not be construed as personal investment advice. While the information provided is believed to be accurate, it may include errors or inaccuracies.
I will not and cannot be held liable for any actions you take as a result of anything you read here.
Conduct your own due diligence, or consult a licensed financial advisor or broker before making any and all investment decisions. Any investments, trades, speculations, or decisions made on the basis of any information found on this channel, expressed or implied herein, are committed at your own risk, financial or otherwise.

How to Identify Double Top Formation - A Long-Haul Bear?How to identify double top formation?
Is the US market still forming this double top formation, or has the pattern already completed, signaling a deeper correction to come?
In this discussion, we will focus on the latter question: whether this bear is going to be a long-haul bear.
3 parts of today tutorial:
1. How to Identify Double Top Formation is completed technically?
2. How to cross reference to its related markets?
3. How do the fundamental developments confirm these technical studies?
E-mini Dow Jones Index Futures & Options
Ticker: YM
Minimum fluctuation:
1.00 index point = $5.00
Micro E-mini Dow Jones Index Futures
Ticker: MYM
Minimum fluctuation:
1.0 index points = $0.50
Disclaimer:
• What presented here is not a recommendation, please consult your licensed broker.
• Our mission is to create lateral thinking skills for every investor and trader, knowing when to take a calculated risk with market uncertainty and a bolder risk when opportunity arises.
CME Real-time Market Data help identify trading set-ups in real-time and express my market views. If you have futures in your trading portfolio, you can check out on CME Group data plans available that suit your trading needs www.tradingview.com
Trading the Micro: www.cmegroup.com

DOW JONES You will regret not taking this buyDow Jones / US30 remains under heavy selling pressure as it has been yet again rejected under the 1week MA50, failing to hold the closings over it of the past 3 candles.
This is the strongest correction of the index since the September 26th 2022 bottom and the start of the Channel Up.
Despite the negatives, the 1week RSI is almost on the 37.50 level, which is where the last higher low of the Channel Up was formed on October 23rd 2023, again under the 1week MA50.
Obviously even though the downside may continue for a few more days, the extent is limited technically, especially since the worst of the tariffs have been priced and only new and more aggressive ones can inflict more non-technical fear on the market.
This is a unique long term buy opportunity, the likes of which saw 2 rallies before of +21.10%.
Even in the event of one more dip, a 48000 target towards the end of the year is very realistic.
Follow us, like the idea and leave a comment below!!
DOW JONES One break away from a rally back to 45000.Dow Jones (DJIA) got stopped on the 4H MA50 (blue trend-line) as the market paused ahead of today's tariffs implementation. This is the 2nd technical rejection since the March 13 bottom, the first being n the 4H MA200 (orange trend-line) last Wednesday.
This bottom is technically the start of the new Bullish Leg of the 1-year Bullish Megaphone pattern, and is very similar, both in 1D RSI and price terms, to the first one (April 19 - May 20 2024). As you can see, we are currently within the sane 0.5 - 0.786 Fib range, where the price consolidated before the eventual 4H MA200 bullish break-out.
If it continues to replicate the 2024 Bullish Leg, then be ready for a straight Resistance test once the 4H MA200 breaks. Our Target is 45000.
-------------------------------------------------------------------------------
** Please LIKE 👍, FOLLOW ✅, SHARE 🙌 and COMMENT ✍ if you enjoy this idea! Also share your ideas and charts in the comments section below! This is best way to keep it relevant, support us, keep the content here free and allow the idea to reach as many people as possible. **
-------------------------------------------------------------------------------
💸💸💸💸💸💸
👇 👇 👇 👇 👇 👇

DOW JONES: 4 week bottom on the 1W MA50. Best time to buy.Dow Jones turned neutral again on its 1D technical outlook (RSI = 46.611, MACD = -297.980, ADX = 37.851) as it is recovering today and more importantly keeps its price action above the 1W MA50. This is the 4th straight week that it trades and holds the 1W MA50, which is shaping up to be the natural long term support. That is keeping the 1W RSI neutral (47.224), which technically suggets that it is the most low risk level to buy. The 1W RSI made a double bottom due to this consolidation and the 1W MACD printed the first light red bar, all of which are similar to the October 23rd 2023 bottom.
Both have been bottoms after bearish waves of the 1.5 year Channel Up and as a matter of fact similar in decline rate (-9.50%). The highest probability level for a rebound and start of the new bullish wave is this, and based on the previous, it should aim for the 2.0 Fibonacci extension (TP = 49,000).
## If you like our free content follow our profile to get more daily ideas. ##
## Comments and likes are greatly appreciated. ##

Weekly Market Forecast: SELL THE INDICES!In this video, we will analyze the S&P 500, NASDAQ, AND DOW JONES Futures for the week of March 31st - April 4th.
The equity markets took a bearish turn last week. This is likely to continue for the upcoming week.
Monday is the end of March. Tuesday brings a new week and new opportunities. April 2nd brings... potentially market flipping volatility. The day the Trump tariffs are implemented.
Be careful. Let the market give you direction, and then get involved.
Enjoy!
May profits be upon you.
Leave any questions or comments in the comment section.
I appreciate any feedback from my viewers!
Like and/or subscribe if you want more accurate analysis.
Thank you so much!
Disclaimer:
I do not provide personal investment advice and I am not a qualified licensed investment advisor.
All information found here, including any ideas, opinions, views, predictions, forecasts, commentaries, suggestions, expressed or implied herein, are for informational, entertainment or educational purposes only and should not be construed as personal investment advice. While the information provided is believed to be accurate, it may include errors or inaccuracies.
I will not and cannot be held liable for any actions you take as a result of anything you read here.
Conduct your own due diligence, or consult a licensed financial advisor or broker before making any and all investment decisions. Any investments, trades, speculations, or decisions made on the basis of any information found on this channel, expressed or implied herein, are committed at your own risk, financial or otherwise.

DOW JONES: Are you ready for what's coming?Dow Jones is neutral on its 1D technical outlook (RSI = 48.157, MACD = -244.290, ADX = 38.724) as it is attempting to recover the 2 month correction. It appears that the bottom has already been made as not only did the price rebound on the LL trendline but it did so on an oversold 1D RSI. This draws comparisons to the last big such correction of Aug-Oct 2023, which also declined by more than -9.40%. They key there was the formation of a 4H Golden Cross.
Right now the price is stuck inside the 4H MA50 - 4H MA200 range, so if it crosses now over the 4H MA200, it will most likely confirm the start of the new bullish wave as it will form a 4H Golden Cross. Technically it can achieve a similar price rally as then, so our thesis remains bullish aiming at the 2.0 Fibonacci extension (TP = 50,000).
## If you like our free content follow our profile to get more daily ideas. ##
## Comments and likes are greatly appreciated. ##

Trump's Auto Tariffs Shake Things Up on Wall StreetTrump's tariffs are clearly not going away. In fact, he's upped the ante with a 25% tariff on all non-US cars, vowed to target pharmaceuticals and promised more are to come on April 2nd. Given the dire weakness in consumer sentiment data, I suspect Wall Street indices may have seen a swing high.
Matt Simpson, Market Analyst at City Index and Forex.com

DOW JONES Last chance to buy before it breaks the 1D MA50.Dow Jones (DJIA) has been trading within a 1.5 year Channel Up pattern since the July 2023 High. The market found itself under heavy pressure recently as the Channel unfolded its Bearish Leg which found Support right below the 1D MA200 (orange trend-line).
As the 1D RSI got oversold (<30.00) and rebounded, this is perhaps the last opportunity to buy low, before it breaks above its 1D MA50 (blue trend-line) on what is technically the new Bullish Leg.
The previous Bullish Leg (November 2023 - March 2024) hit the 2.0 Fibonacci extension on a +23.94% rise, before it broke below its 1D MA50 again. As a result, it is possible for Dow not to break again below its 1D MA50 once broken, before it reaches the 2.0 Fib which sits at 50000. Our Target is a little lower than that at 49000.
-------------------------------------------------------------------------------
** Please LIKE 👍, FOLLOW ✅, SHARE 🙌 and COMMENT ✍ if you enjoy this idea! Also share your ideas and charts in the comments section below! This is best way to keep it relevant, support us, keep the content here free and allow the idea to reach as many people as possible. **
-------------------------------------------------------------------------------
Disclosure: I am part of Trade Nation's Influencer program and receive a monthly fee for using their TradingView charts in my analysis.
💸💸💸💸💸💸
👇 👇 👇 👇 👇 👇

Weekly Market Forecast SP500 NASDAQ DOW: Short Term BUYS!In this video, we will analyze the S&P 500, NASDAQ, AND DOW JONES Futures for the week of March 24 - 28th. We'll determine the bias for the upcoming week, and look for the best potential setups.
The equity markets have been choppy lately, but this week may be different. The economic calendar shows a smooth week ahead, as there are no NFP, FOMC, or similarly volatile news ahead to potentially reverse a market out of the blue. The indices show potential to break consolidation and move upwards. So we wait until there are definitive market structure shifts to occur, acting as confirmations.
Only then do we pounce!
Enjoy!
May profits be upon you.
Leave any questions or comments in the comment section.
I appreciate any feedback from my viewers!
Like and/or subscribe if you want more accurate analysis.
Thank you so much!
Disclaimer:
I do not provide personal investment advice and I am not a qualified licensed investment advisor.
All information found here, including any ideas, opinions, views, predictions, forecasts, commentaries, suggestions, expressed or implied herein, are for informational, entertainment or educational purposes only and should not be construed as personal investment advice. While the information provided is believed to be accurate, it may include errors or inaccuracies.
I will not and cannot be held liable for any actions you take as a result of anything you read here.
Conduct your own due diligence, or consult a licensed financial advisor or broker before making any and all investment decisions. Any investments, trades, speculations, or decisions made on the basis of any information found on this channel, expressed or implied herein, are committed at your own risk, financial or otherwise.

DOW JONES targeting 50000 on this final Bull yearDow Jones / US30 posted the first green weekly candle after hitting last week the 1week MA50.
This is obviously a critical support level as it has been holding since the October 30th 2023 rebound.
As this chart shows, Dow has been repeating the same patterns, Cycle after Cycle.
Right now it has entered the Final Year of Bull, which is the part where it rises aggressively to form the Top before the new Bear begins in the form of a Megaphone pattern.
The previous Bull peaked on the 2.382 Fibonacci extension of the Megaphone.
This means that a 50000 Target for Dow is perfectly plausible by the end of 2025.
Follow us, like the idea and leave a comment below!!

DOW JONES: MA50-100 Bearish Cross says we've bottomed.Dow Jones is almost neutral on its 1D technical outlook (RSI = 43.171, MACD = -608.620, ADX = 62.568), rising aggressively since last week. Technically that was the bottom no just on the 8 month Channel Up but also on the LL trendline. We've seen the very same LL bottom on the October 2023 and March 2023 lows, all of which had oversold 1D RSIs. The 1D MA50-100 Bearish Cross marked those bottoms and today we've completed a new one. Technically the index can rise as high as the 2.0 Fibonacci extension (TP = 49,000).
## If you like our free content follow our profile to get more daily ideas. ##
## Comments and likes are greatly appreciated. ##

US30; Heikin Ashi Trade IdeaPEPPERSTONE:US30
In this video, I’ll be sharing my analysis of US30, using my unique Heikin Ashi strategy. I’ll walk you through the reasoning behind my trade setup and highlight key areas where I’m anticipating potential opportunities.
I’m always happy to receive any feedback.
Like, share and comment! ❤️
Thank you for watching my videos! 🙏

I've Cracked the Bullish Code on Dow 30 Using COTNot financial advice.
YM is setup for longs based on COT Commercial Positioning Extreme, Valuation, Sentiment & Seasonals.
