A perfect ending? who will end the Bitcoin bull market?First of all, I am not a market predictor. The reason why I made this topic is because I found the perfect geometric structure on the Bitcoin price chart. This geometric structure has perfectly verified the high and low points of Bitcoin on the weekly chart since 2017. I am surprised indeed. If this perfect structure is to be maintained, the all-time high of Bitcoin that we have just experienced may be the end of the first phase of the bull market since last year with principle of least resistance line.
With all-time high of ~ 58504$ on Feb, 2021,
~19927$ high price on Dec, 2017 is perfectly 0.618 (Key golden ratio) of this all-time high;
~3093$ low price on Dec, 2018 is perfectly all-time low (Zen Theory, 1st buying point);
~14030$ high price on Jun, 2019 is perfectly 0.5 (Key golden ratio) of this all-time high;
~3772$ low price on Mar, 2020 is perfectly 0.114 =(1-0.886) of this all-time high; (Zen Theory, 2nd buying point);
With these four verified high/low price points, the history makes a perfect geometric structure in nature. This is the reason why I name the topic? From the long term, I am still bullish on Bitcoin. However, a retracement will be helpful to form Zen Theory pivot zone and accordingly a 3rd buying point, which may be happen in 2 years later.
To form a Zen 3rd buy point on weekly chart, there are three possible support levels,
1. 0.886 of all-time high, which is ~41700$
2. 0.786 of all-time high, which is ~31287$
3. 0.618 of all-time high, which is ~19099$
The lower ratio value, the longer time it takes.
When will a weekly level dump happen?
It is still taking some time for sub-week level pivot zone to form. From weekly BBPMACD indicator, we can see although bull power shrinks quickly, bear power still very low to activate a pump in weeks.
Who will be the driving force behind the Bitcoin price dump?
The answer is FED. It is the central bank of all global central banks. US GOVERNMENT BONDS 10 YR YIELD (US10Y) have surged recently, causing global risk assets to dive. This means that the global cost of risk-free assets has suddenly dropped to the level of ~64. Based on my own calculation, current equivalent Bitcoin PE Ratio is around 32. This means that when US GOVERNMENT BONDS 10 YR YIELD rises to 3.14%, the price of Bitcoin may drop sharply. The S&P 500 index may fall first at around 2.5%.
ZEN

🔥 ZEN Inverse Head & Shoulders PatternZEN has almost completed an inverse head & shoulders pattern, which is a strong bullish pattern. To trade this, wait for the pattern to complete. The price has to close above the Entry line.
On the chart I’ve marked two potential areas of resistance, R1 and R2. These areas are based on recent swing highs. Do your own due diligence.
Happy trading!


I didnt know $ZEN was called horizen wtf stupid name uhm, equal highs, kinda took some liquidity already, if not enough then buy lower box and be number go up wew
$71 also nice on ltf idk

$ZEN, Looking for a 1st interaction w/ 125k sats resistance...$ZEN
Switched to a Buy once again on the 12H (usually strong) & across all HTFs
Looking for a 1st interaction w/ 125k sats resistance level and if manage to break above it, then '20 highs.. (30%)
Volume for now looking kinda weak so careful..
#ZEN

Horizen (ZEN) Strong Breakout, Down Trendline BrokenZENBTC (Horizen) is coming out really strong out of its downtrend with a strong bullish breakout.
The down trendline that started on 25-Nov. is being obliterated today, huge strength and volume which both signals the reversal of a trend... Additional growth can follow for this altcoin pair.
The RSI and MACD are also very telling with a strong curve up... Trending higher.
Since we ended up with a higher low compared to the 20th of November, we can expect a higher high to hit next... This means, that prices will go to 0.0010291 and beyond.
This is not financial advice.
Thanks a lot for your support.
Namaste.

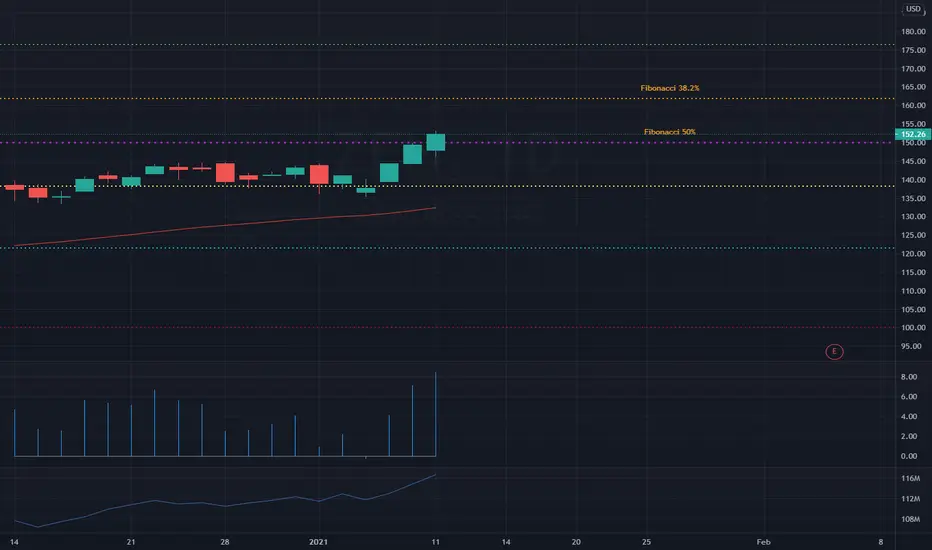
$ZEN TK Cross above cloud.I found a bullish TK cross on $ZEN, the trailing line is above price action and green bullish cloud ahead on 1 day candle chart.
$ZEN missed on earnings but had a solid rally the day after earnings was announced.
Will be looking to enter a trade next week with tight stop.
PT $170 short term

Horizen (ZEN) • Final major resistance before next 10xWe are just meeting final structural target based on past PA.
I still see this a hold because chances this will do another 10x from where we are.
In terms of fundamentals is still strong. Backed by Grayscale, continuous development and growing community.
In terms of technicals is still strong. Volumes show steady growing interest but nothing really usual or fomo like volume signatures, major trendlines has not been broken, trading above clouds, consistently trading above weekly averages. I see no reason to sell this coin.

ZENBTC STRONG CHARTHello traders
As you can see in the chart above, Horizen (ZEN) has broken its descending Trendline, and I'm looking forward to seeing it touch the 0.618 Fibonacci level.
I will update the Fundamentals and the ZENUSDT on the next Idea.
------------------------------------------------------------------------
What is your opinion? Comment below.
If you like the idea, please hit the like button and follow me so that you won't miss the updates. The information given is never financial advice. Always do your research too.
Goodluck.

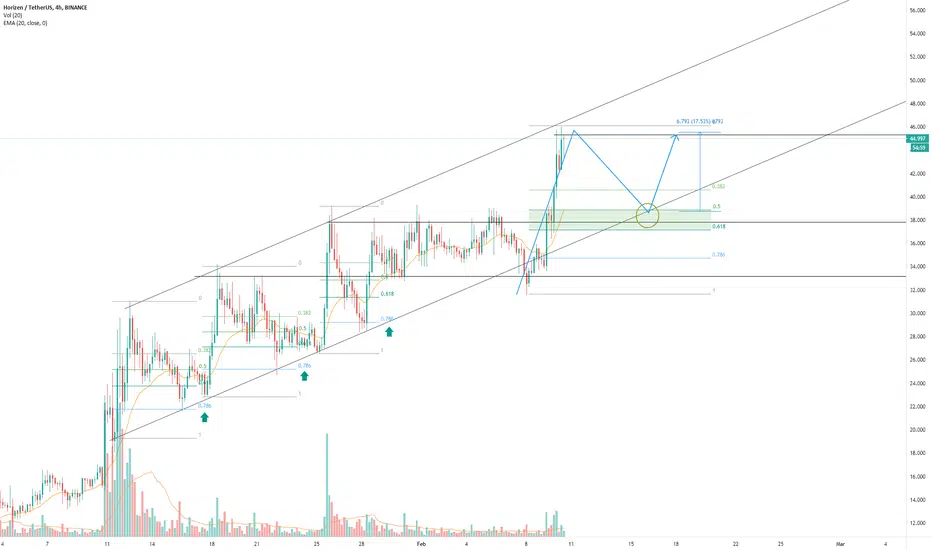
ZENUSDT - BUYPrice trading nicely within a bullish channel and historically retraces deep to the to the 78.6 fibb level.
I have marked the confluence zone of the 32.8% of the last impulse move, previous support and the January 11th trend line as a potential buy zone.
Zen breaking out.Top/bottoms for the upcoming weeks. Analysis based on Gann angles and linear regression. Also it's in Grayscale's portfolio and has the fundamentals to back that up. There might be a dip to 29,4 if the crypto market circumstances drastically change.

Horizen (ZEN) Hits New High + Next Target MappedGood things happening for the Altcoins/Cryptocurrency markets... Today, Horizen (ZENBTC) hit a new high compared to Nov. 2020 after a higher low.
This is great news because it signals that many of the other altcoins will also move higher and hit new highs, which opens the door for even more growth.
This is the same chart I drew on Jan. 10 but updated:
The "next target" is marked on the chart.
You can find additional targets if you move the chart higher.
Sit back, relax and just enjoy.
Namaste.


ZENUSDT - POTENTIAL RETRACEMENT ANALYSIS
- ZENUSDT brokeout above the previous ATH resistance.
- Price action is to printing a rising wedge pattern.
- RSI is a printing a bearish divergence signal.
SELL ENTRY ⬇️
- Breakdown below the rising wedge support.
TARGETS 🎯
- Fibonacci retracement levels
- Flip horizontal support (previous ATH).
SETUP INVALIDATION ❌
- Breakout above the rising wedge resistance.

ZENUSDT - Descending channel ANALYSIS 🔎
- ZENUSDT is printing a descending channel.
- Price is testing the descending channel resistance.
- The minor uptrend is supported by an ascending trendline support.
POSSIBLE PRICE ACTIONS
- Bullish ⬆️: breakout above the descending channel's resistance.
- Bearish ⬇️: breakdown below the ascending trendline support.
TARGETS 🎯
- Bullish ⬆️: horizontal resistance levels (R1, R2).
- Bearish ⬇️: horizontal support level (S1), descending channel support.


Horizen (ZEN) / BTC Main trend.Horizen (ZEN) / BTC Main trend. Falling wedge. The graph is logarithmic. Timeframe 1 week. Pivot zones and target levels are shown on the chart. The first target is the resistance of this formation at about 100%. Also, the resistance of the wedge (main trend) will act as a potential trend reversal zone. If the resistance is broken through and consolidates above it, the main trend will reverse.
Fundamental.
The industry's first decentralized and fully customizable sidechain protocol that solves the biggest challenges when applying blockchain solutions to real-world use cases.
Event.
Coin. Mineable. Around December 2, the Horizen blockchain will undergo a halving of the first block reward. This event will take place at block 840,000 in which the block reward will be halved from ZEN 12.5 per block to ZEN 6.25 per block. The remuneration ratio for stakeholder groups will remain the same.
Grayscale
One of the largest funds, Grayscale, whose assets are estimated at more than $ 10 billion, announced publicly on 20 11 2020 in its official twitter that it has this cryptocurrency in its invest. portfolio in the amount of $ 2.8 million. More precisely, it was shown the assets that the fund has. This is easily verified.
On the one hand, you understand that bragging about your crypto portfolio (I do not mean this cryptocurrency), and the overall fantastic balance of the crypto portfolio, can be just manipulation in order to attract the attention and money of investors. In reality, it is quite possible that they have an order of magnitude less cryptocurrencies.
But I will say one thing, for such an average liquid altcoin, $ 2.8 million is a lot. I was very surprised that there is this altkin among only the top alt. You need to understand that if they have a position on this alt, even for half the amount, then with this test cryptocurrency everything will be more than all right in the near future, and it does not matter if the project will fail or not. Although if we compare the total balance and the number of other cryptocurrencies, then the position of this coin is "dust". But, it is the public statement that is important.
I think that over time they themselves will pump this cryptocurrency to the point of inadequacy. All the assets they have will be pumped up heavily, and the lower the liquidity, the higher the percentage.
Grayscale cryptocurrency portfolio in million dollars:
9,658.5 BTC
1.291.6 ETH
ETC 76.4
LTC 67.3
BCH 46.4
ZEC 11.3
XRP 10.2
XLM 1.4
Horizen (ZEN) 2.8

ZENUSDT - Potential sell entry 🔽ZENUSDT brokedown below the ascending trendline support.
RSI printed a bearish divergence signal.
Price action is printing a descending triangle pattern.
Sell entry ⬇️ - breakdown below the descending triangle's horizontal support.
Target 🎯 - fibonacci extension levels, descending channel support.
Setup invalidation ❌ - breakout above the descending triangle's inclined resistance.


ZEN - Perfect hits for 130%+, Where do we go from here?ZEN has made dreams come true yet again, if you followed my last idea it was good for an EASY 130% without even catching the retrace!! Check it out below:
So where do we go from here?
Well obviously after this much growth we expect a retrace, what goes up must come down after-all. Interesting it was growing against btc's dump today, leading me to believe there may be some more short term headroom.
That said, indicators point more towards a potential retrace. If it does I expect a decent one as profit taking grips hold, but then we'll probably pop right back up again to higher highs for another 200% for predicted bounce point.
Bullish fractal present, heavy up pressure but overbought and TD9 just complete a green sequence, with this candle being candle 0. that means we'll either totally nuts from here, or more likely get a reversal.
Either way, there is more headroom on this chart. When it happens, we'll have to wait and see!

Long | ZENNYSE:ZEN
Possible Scenario: LONG
Evidence: Price Action
This is my idea and could be wrong 100%.
Horizen ZEN - The Path to $100- Volume has driven into privacy coins such as ZENUSD after big tech began an online censorship & purge campaign.
- Horizen is uniquely positioned to outperform other privacy coins with a market cap well below XMR and ZEC, and a supply replicating Bitcoin in scarcity (21m maximum ZEN).
- Horizen's privacy component is optional, similar to ZEC, which makes it less of a regulatory target vs XMR and more flexible and useful.
- Horizen is supported by Grayscale who openly advertise their Horizen Trust to investors. This platform will continue to drive further demand into ZEN.
- $100 Horizen would = $800m market cap (at current supply). Well and truly within reason as I expect this coin to surpass $1bn in market cap eventually.
- $33 is major resistance, with blue sky after that breaks, towards $100.

Crypto Coins Watchlist for Next Long Run 20210111Crypto Coins Watchlist for Next Long Run which might have Good Performance
BTICOIN, TOMO Tomochain, SOL Solana, AVAX Avalanche, MKR Maker, NEO, IOST, ZEN Horizen
BTCUSD TOMOUSD SOLUSD AVAXUSD MKRUSD NEOUSD IOSTUSD ZENUSD
DISCLAIMER
This is only a personal opinion and does NOT serve as investing NOR trading advice.
Please make your own decisions and be responsible for your own investing and trading Activities.
