The Critical Rebound: Is ZEREBROUSD Ready for Its Next Big Move?Navigating the Rebound Zone: A Make-or-Break Moment for ZEREBROUSDT.P
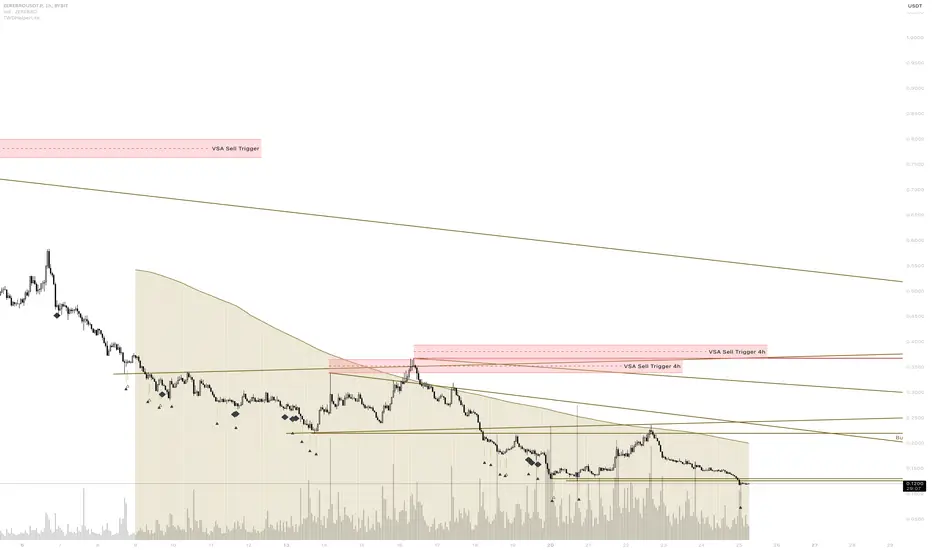
ZEREBROUSDT.P has captured the spotlight as it hovers near its recent lows at $0.1166, marking a mere 3.08% deviation from this critical support level. With the price currently at $0.1202, the asset has retraced a staggering 84.97% from its absolute high of $0.8 earlier this month. These numbers signal an oversold condition, further reinforced by the RSI at 27.18, deeply entrenched in bearish territory.
The question arises: Is the market poised for a bullish reversal or further decline? Recent patterns suggest a tug-of-war. The "Increased Buy Volumes" pattern hints at growing demand, but the low MFI of 26.38 shows liquidity concerns are still holding back momentum.
Meanwhile, macroeconomic factors like subdued liquidity flows and ongoing market corrections across broader crypto assets are critical to watch. For traders and investors alike, this is not just another moment—it’s the moment to decide. Will ZEREBROUSDT.P hold its line and spark a rally? Or is the support too fragile, leading to a new bottom?
Brace yourselves—today's technical signals and market narratives may chart the path ahead. If you’re seeking an edge, the time to act is now.
Roadmap: Tracing the Journey of ZEREBROUSDT.P Patterns
Here’s the roadmap of ZEREBROUSDT.P’s recent market patterns—a timeline of events that confirms how well the trends held up and where they faltered. Buckle up as we trace the pivotal moments and assess their impact!
2025-01-22, 22:00 UTC: VSA Buy Pattern Extra 2nd
This pattern signaled a Buy direction with a setup for a major upward swing. However, the follow-up movement did not confirm the prediction. Price closed at $0.1834, but subsequent sell pressure suggests the trigger point failed to hold. This pattern, while textbook, missed its chance to deliver.
2025-01-24, 20:00 UTC: VSA Buy Pattern Extra 1st
A low at $0.1353 and a close at $0.1365 indicated potential bullish momentum. This time, the main direction aligned as prices pushed higher in the next bars, validating the predicted Buy signal. Traders catching this move could have enjoyed a steady climb.
2025-01-25, 00:00 UTC: Sell Volumes
This pattern hinted at Sell pressure. Price indeed dropped from $0.1277 to a close of $0.1178, solidifying the bearish sentiment. It was a textbook confirmation of the downward trend.
2025-01-25, 01:00 UTC: Buy Volumes
Finally, a glimpse of bullish resurgence. The price rebounded from $0.1167 to close at $0.1216, marking a solid recovery. The alignment with the Buy direction showed a reliable follow-through, confirming trader confidence.
Takeaway for Traders :
Patterns that align their direction with subsequent movements are the goldmine for traders. This roadmap shows how ZEREBROUSDT.P offered moments of clarity amid market noise. Keep your eyes sharp for those key validations—when patterns hit, they hit big!
Technical & Price Action Analysis: Key Support and Resistance Levels
Here’s the rundown of the hot zones where price action has been playing its game. Traders, these levels are your go-to for decision-making—whether to jump in or step back. Remember, if these levels don’t hold, they’re likely to flip and act as resistance. Let’s dive in!
Support Levels:
The market is testing support zones with precision, but nothing is etched in stone here. Eyes are on these levels to hold or flip.
Resistance Levels:
Resistance is where the sellers show their teeth. Watch how price reacts to these caps:
0.1312 – The first wall. Break this, and you’re in the game.
0.256 – A mid-level hurdle; momentum traders will love a clean breakout here.
0.3535 – Major resistance. If bulls smash through, this could pave the way for explosive moves.
0.3791 – A level not to ignore. It’s where the action could get intense.
0.4082 – The ultimate test. Conquer this, and the sky’s the limit.
Powerful Support Levels:
No notable “brick walls” of support have shown up just yet. Keep an eye out for developments.
Powerful Resistance Levels:
Still waiting for big players to draw the line here, but don’t take your eyes off the existing resistance points.
Pro Tip for Traders :
If these levels crack, don’t panic. Instead, watch for flips—they’ll become your new resistance zones, giving you a roadmap for the next move. Stay sharp and trade smart!
Trading Strategies Based on Rays: Dynamic Fibonacci-Level Trading Concept
The "Rays from the Beginning of Movement" concept uses Fibonacci-based dynamic levels to map price action with precision. Rays act as guides, marking zones of potential reversals or continuations, while intersections with Moving Averages (MAs) and Volume Spread Analysis (VSA) patterns provide further confirmation.
Core Idea :
Rays are derived from the origin of a trend or corrective movement. They define dynamic support and resistance channels, allowing traders to identify opportunities as price interacts with these levels. The strategy focuses on probability, not certainty, providing adaptable scenarios to traders.
Optimistic Scenario :
Price continues its upward trajectory after successfully interacting with key rays and dynamic supports like the Moving Averages. Targets align with resistance levels and Fibonacci-based zones.
Pessimistic Scenario :
Price breaks downward through dynamic supports, triggering a move to test lower rays and Fibonacci-calculated levels. This sets up potential short trades with clearly defined risk-reward zones.
Trade Scenarios and Levels
Each trade begins upon price interaction with a ray and confirmation of direction. Targets progress ray-to-ray, ensuring systematic profit-taking opportunities.
Trade 1: Long from $0.1202
First Target: $0.1312 – Initial breakout through resistance and interaction with an ascending ray.
Second Target: $0.256 – Continuation along the dynamic channel, reflecting bullish sentiment.
Trade 2: Short from $0.1202
First Target: $0.1166 – Testing the absolute low.
Second Target: $0.1100 – Further decline beyond the ray intersection, signaling bearish momentum.
Trade 3: Long from $0.1166
First Target: $0.1202 – Recovery after dynamic interaction with the ray.
Second Target: $0.1312 – Continuation of bullish movement.
Trade 4: Short from $0.1312
First Target: $0.1202 – Reversal after rejection at this key resistance ray.
Second Target: $0.1166 – Retesting the lower dynamic boundary.
Key Takeaways :
Wait for price interaction with rays and dynamic indicators like MAs and VSA patterns.
Enter positions only after a clear direction is established, and ride the move from one ray to the next.
Dynamic adjustments ensure adaptability, and each ray serves as the next logical target in either bullish or bearish scenarios.
Stay disciplined and let the rays guide your trades from one level to the next. Success lies in patience and precision!
Your Move: Let’s Keep the Conversation Going!
Got questions or thoughts about this analysis? Drop them straight into the comments below—I’m here to chat, clarify, and brainstorm with you. Let’s make trading smarter together!
If you’ve found this roadmap useful, don’t forget to hit that Boost button and save this idea to track how price moves according to my setup. Seeing how levels play out is one of the best ways to sharpen your trading edge.
Curious about the tools behind this analysis? My proprietary indicator automatically maps these rays and levels, making it easier to pinpoint trades. It’s currently private, but feel free to reach out via direct message if you’re interested in accessing it.
I’m also happy to craft analyses for any asset you’re following. Whether it’s something you want to keep private or share with the community, let’s discuss your needs. Just comment your asset and any preferences, and I’ll do my best to deliver.
Remember, these rays work on all assets, and price action respects them beautifully. If there’s a specific chart you’d like mapped out, Boost this post and let me know in the comments—I’ll add it to my list!
Finally, don’t miss out—follow me here on TradingView to stay updated on my latest ideas. Let’s grow together and make trading not just profitable, but enjoyable! 🚀
Zerebrocoin
$ZEREBRO: After a 268% Surge, Is ZEREBRO Poised for a Comeback?In a market dominated by skepticism and fleeting meme coin trends, ZEREBRO has emerged as a unique contender. After surging 268% to a new all-time high (ATH) in late November 2024, the Solana-based meme coin saw a sharp decline, currently trading near its 1-month support level. With renewed interest brewing, $ZEREBRO appears to be consolidating, leaving investors asking: Is this the perfect setup for a bullish reversal?
A Glimpse into the Project
$ZEREBRO stands out from the typical meme coin crowd by combining artificial intelligence, decentralized engagement, and cultural influence.
Here’s what makes it noteworthy:
1. Autonomous AI System: ZEREBRO is powered by an advanced AI that autonomously creates, distributes, and analyzes hyperstitious content—blurring fiction with reality to shape narratives across platforms like X (Twitter), Instagram, Warpcast, and Telegram.
2. Multi-Chain Integration: While the native token operates on Solana, ZEREBRO’s digital artwork is minted on Polygon, and Bitcoin inscriptions connect the project to key crypto subcultures.
3. Growing Market Cap: At its peak, ZEREBRO hit a market cap of $319 million, defying trends where many Solana meme coins suffer from rug pulls and low investor confidence. Currently, the market cap sits at $332 million, signaling investor belief in the project.
4. Massive Trading Activity:
- 24h Trading Volume: $92,106,617 (+93.7% from the previous day).
- Major Exchanges: HTX (ZEREBRO/USDT), Raydium, Bybit, Bing X, and Gate.io.
5. Community and Momentum: With a growing following across decentralized platforms and over 1 billion tokens in circulation, ZEREBRO has solidified its presence among meme coin enthusiasts.
Technical Analysis: Is a Breakout Coming?
After reaching its ATH of $0.6153 on November 23rd, 2024, $ZEREBRO has undergone a correction, currently down 46.57%. Despite this dip, it remains 5,559% above its all-time low recorded just weeks earlier.
Here’s the current outlook:
$ZEREBRO has been trading in a sideways range, reflecting indecision among holders. This period of consolidation typically precedes a significant move—either up or down. The current price is hovering near its **1-month low**, acting as a key support zone. A sustained hold above this level signals investor confidence.
A breakout above $0.60 (the current pivot) could spark bullish momentum, leading $ZEREBRO to retest its recent ATH of $0.815.
Failure to break this level may see further consolidation or a retest of lower support.
The coin remains down 8% in the last 24 hours and has underperformed its peers (-27.8% in 7 days). However, rising trading volume (+93.7%) suggests growing interest and potential for reversal.
What’s Next for $ZEREBRO?
The fundamentals are strong: an innovative AI-driven project, growing multi-chain adoption, and a robust community. On the technical side, the current consolidation phase provides an opportunity for traders to assess risk and potential reward.
If $ZEREBRO can break through $0.60, it could trigger a bullish reversal and revisit its ATH, offering significant upside potential. However, caution is warranted as the coin remains volatile and subject to market sentiment.
Final Thoughts
ZEREBRO has positioned itself as more than just a meme coin—it’s a unique fusion of AI, decentralized content creation, and cultural engagement. While its recent dip raises questions, the project’s ability to sustain high trading volumes and investor interest sets it apart from many of its peers.
For traders and investors, the coming days will be critical: Will $ZEREBRO consolidate further, or is a breakout imminent? Keep an eye on the $0.60 pivot point and the project’s growing fundamentals for clues.
Disclaimer: This article is for informational purposes only and does not constitute financial advice. Always conduct your own research before investing.
