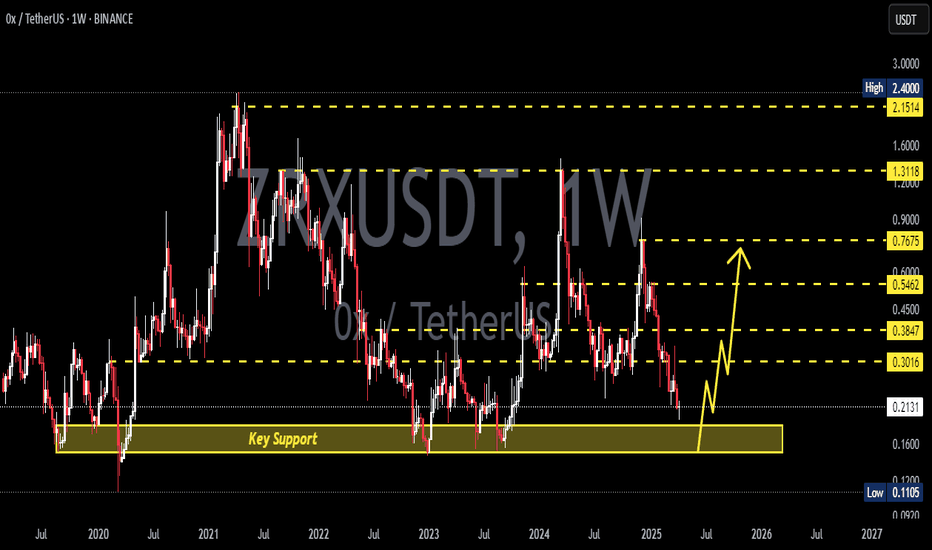
Zrxusdlong
ZRXUSDT: Local Waves Count And Good OpportunitiesThe ZRX coin was included in the list of my trading plans to track the possible opening of a positions.
The wave structure is well read and the trading plan has excellent risk to profit parameters.
In general, my approach is that I expect the end of the decline within the expected zigzag and the continuation of the price recovery within the upward wave C of wave 4.
For a long position, the risk to profit ratio is about 1:5.
In addition, after the completion of the impulse in wave C, I will expect price decline to new lows, which in the future may allow you to get a good risk to profit ratio of 1:3 for a short sales.
I advise you to carefully consider this trading plan, because. it is in some way a standard in the methods of planning trading actions.
In addition, I do not rule out (just in case) an alternative scenario for the development of events, when the downward movement has already been completed, and wave C will turn out to be wave 3 in a five-wave upward model.
Best Regards,
CEO Tornado Capital
ZRXUSDT Parallel ChannelZRXUSDT (4H CHART) Technical Analysis Update
Parallel Channel
ZRX/USDT currently trading at $1.92
Buy-level: Above $1.86 - $ 1.92
Stop loss: Below 1.79$
Target 1: $2.00
Target 2: $2.20
Target 3: $2.40
Target 4: $2.75
Max Leverage: 3X
ALWAYS KEEP STOP LOSS...
Follow Our Tradingview Account for More Technical Analysis Updates, | Like, Share and Comment Your thoughts.
ZRXUSD is aiming the $1 level and bullish pressure is mountingZRXUSD
In daily timeframe we have seen a clear bullish engulfing pattern today. And the candle was so big enough to push the upper side limit which is holding this crypto since May 2020 and ZRXUSD has managed to reach the yearly high around 0.960000 level which is around $1 and felled below the .50 level and started trading within a confined range and it cannot break the 0.55 resistance level.
Today we have seen a clear break out of the upper side immediate resistance. And 0.60 will act as decent resistance for the bull. And after that 0.70,0.80 and 0.90 will come in to light in coming days.
We can see the series of Minor Elliot correction waves are formed within this narrow trading range. During the weekend investors will search for a new lows to buy @ the tip rule.
.30 has clearly acted as good support for the bull since may this bear cannot breach this level. Currently .382 Fibonacci level is also acting as strong resistance and the today upward thrust was capped by the .50 Fibonacci retracement level comes around .740000 level.
On upper side .824000 would be a decent target for the bull as its coincides with .786 Fibonacci level. $1 will be a swing target
All the 02 EMA's (50,100,200) is acting as decent support for the bull.
Ichimoku cloud is still red and the cloud is acting as decent support too
On Bollinger band it has breached the upper side of the band and the band width is widening and its a clear sign of further bullish pressure was mounting.
ZRXUSD: Long is possibleAt D1, the cloud is directing upward, indicating an uptrend.
And the price found support at the Fibonacci level of 61.8%-50%.
At H4, the cloud is directing downward, indicating a price correction at the D1 timeframe.
In addition, the RSI reached the oversold level, after which the price broke the local downtrend line of the falling wedge model.
We recommend buying ZRXUSD now with a stop loss at 0.58 and take the profit near the level of $1 - $1,1.


