USD/JPY Correction Could Offer Shelling OpportunityIn my USD/JPY analysis last week, I mentioned a high probability of the pair breaking support and continuing its decline.
That scenario has played out, with USD/JPY dropping below the key 151 support zone and now trading around 149.50.
An upside correction may be next, potentially providing traders with an opportunity to enter short and ride the downtrend.
Conclusion:
Rallies around 150.50 should be seen as selling opportunities, and as previously stated, I expect a further drop to 146. 📉
Disclosure: I am part of Trade Nation's Influencer program and receive a monthly fee for using their TradingView charts in my analyses and educational articles.
Forex market

Market Analysis: GBP/USD Gains StrengthMarket Analysis: GBP/USD Gains Strength
GBP/USD is attempting a fresh increase from the 1.2600 zone.
Important Takeaways for GBP/USD Analysis Today
- The British Pound is attempting a decent increase above the 1.2620 zone against the US Dollar.
- There is a connecting bullish trend line forming with support at 1.2625 on the hourly chart of GBP/USD at FXOpen.
GBP/USD Technical Analysis
On the hourly chart of GBP/USD at FXOpen, the pair started a downside correction from the 1.2690 zone. The British Pound traded below the 1.2650 zone against the US Dollar.
A low was formed near 1.2605 and the pair is now attempting a recovery wave. There was a break above the 50% Fib retracement level of the downward move from the 1.2690 swing high to the 1.2605 low.
The pair even spiked above the 76.4% Fib retracement level of the downward move from the 1.2690 swing high to the 1.2605 low and settled above the 50-hour simple moving average.
On the upside, the GBP/USD chart indicates that the pair is facing resistance near 1.2675. The next major resistance is near the 1.2690 level. If the RSI moves above 60 and the pair climbs above 1.2690, there could be another rally. In the stated case, the pair could rise toward the 1.2750 level or even 1.2820.
On the downside, there is a major support forming near 1.2625. There is also a connecting bullish trend line forming with support at 1.2625. If there is a downside break below the 1.2625 support, the pair could accelerate lower.
The next major support is near the 1.2605 zone, below which the pair could test 1.2560. Any more losses could lead the pair toward the 1.2525 support.
Trade on TradingView with FXOpen. Consider opening an account and access over 700 markets with tight spreads from 0.0 pips and low commissions from $1.50 per lot.
This article represents the opinion of the Companies operating under the FXOpen brand only. It is not to be construed as an offer, solicitation, or recommendation with respect to products and services provided by the Companies operating under the FXOpen brand, nor is it to be considered financial advice.

USD/JPY: Liquidity Grab Below Weekly LowThe chart shows that the price has grabbed liquidity below the weekly low, potentially triggering a bullish reaction. Analyzing the current USD/JPY situation, recent economic data highlights bearish pressure on the dollar due to declining consumer confidence in the U.S. and expectations of Federal Reserve rate cuts, while the yen is strengthening on the back of more solid economic indicators. Technically, the price has rejected a key demand zone and remains below the psychological threshold of 150.00, which acts as a crucial resistance. If the price confirms a bullish structure on lower timeframes, we could see an upward move towards the 152.00-152.50 area, aligning with a supply zone and moving average confluence. However, a close below recent lows could invalidate this outlook, paving the way for a further drop toward the next support at 146.00.

+150 pips Best Level to Short EURNZD from Resistance🔸Hello traders, let's review the H2 chart for EURNZD today. Trading
near premium prices of the multiweek range, closing in on heavy S/R
Currently risk/reward is shifting in bears favor, so it's recommended
to look for sell side setups in EURNZD.
🔸Heavy overhead mirror S/R zone at 8440/8480 expecting reversal
from overhead resistance. current bid is 8375 so final push incoming
before we can get a decent entry on sell side.
🔸Recommended strategy for EURNZD traders: focus on short selling any rips/rallies near MS/R 8440/8480 price is currently trading near premium levels and is almost maxed out already, limited upside. TP1 bears +75 TP2 bears +150 pips final exit 8300 keep in mind this is a swing trade setup so naturally will take more time to complete / hit both targets. good luck traders!
🎁Please hit the like button and
🎁Leave a comment to support our team!
RISK DISCLAIMER:
Trading Futures , Forex, CFDs and Stocks involves a risk of loss.
Please consider carefully if such trading is appropriate for you.
Past performance is not indicative of future results.
Always limit your leverage and use tight stop loss.

GBPUSD UpdateGBPUSD currently moving in a range between strong supply and demand zone (1.26200 to 1.26730). we can go for high probability setup after break of zone.
Now see if it goes to break the resistance area (1.26730 to 1.26910) then we can go for buy trade on retesting and market structure shift. our next target will be (1.27280) and above liquidity.
And if it goes down and break the demand zone which is (1.26200) then we can go for sell till next demand zone or liquidity.
Do follow us to get notified of new publication. Hit like and leave a comment if you find that setup profitable.

EURSEK at Major Support Level – Bullish Rebound ExpectedOANDA:EURSEK is approaching a key demand zone, which has historically acted as strong support. The recent sharp decline has brought the price back into this area, increasing the likelihood of a potential bullish reaction.
If buyers step in and confirm support within this zone, we could see a rebound toward the 11.25000 level, aligning with a corrective move after the recent sell-off. However, failure to hold this support could signal further downside continuation.
Traders should watch for bullish confirmation signals, such as rejection wicks, bullish engulfing patterns, or increased buying volume, before considering long positions.

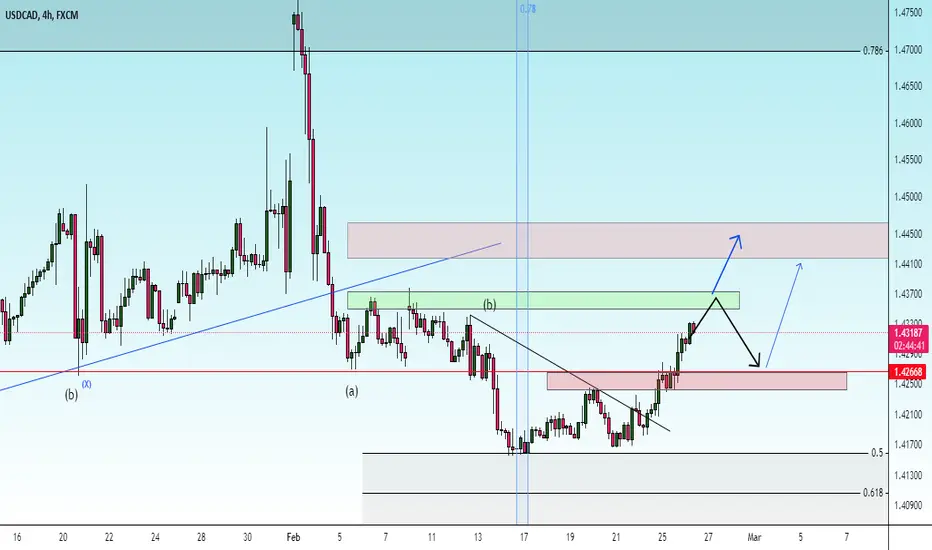
Rally Spotted in USDCADAs USDCAD continues with the uptrend creating higher highs and swings next target observed is the next price imbalance observed and marked in the chart, with a strong psychological support of 1.43000 may advance forward.

USD/CHF - Strong supply level.Hi all, been having a pretty successful run recently. Stay tuned for more updates or follow me for more.
Currently at a Strong Resistance level.
Price has sold off pretty heavily from this level and we will be looking for a retracement to sell further down once again.
Currently price has made a Descending Wedge pattern signalling to me as a Bullish breakout towards this supply zone.
Taking out all buy side liquidity before selling off to sell side liquidity for external views. Looking for a 50PIP stop to a 300PIP return.
Follow if you wish to stay connected or message for more understanding


AUDCAD Short Trade Analysis – Sell at 0.9068🔹 Entry: 0.9068
🔹 Trend: Bearish
🔹 Potential Pullback Levels: 0.9090 - 0.9100
🔹 Target: 0.9020 - 0.9000
🔹 SL: Above 0.9110
AUDCAD remains in a selling zone, and we are maintaining a short position from 0.9068. While short-term price action may push the pair toward 0.9090 - 0.9100, the overall trend favors sellers.
🔍 Technical Analysis:
✅ Moving Averages: Price is trading near key resistance levels with potential rejections.
✅ Structure: Lower highs and lower lows indicate bearish momentum.
✅ Key Resistance: 0.9090 - 0.9100
✅ Key Support: 0.9020 - 0.9000
As long as AUDCAD remains below 0.9110, the bearish outlook remains valid. A break below 0.9050 could accelerate the downside move.
📉 Sell on rallies, stay patient, and follow the trend!
#AUDCAD #Forex #TechnicalAnalysis #PriceAction #SellSignal

EUR/USD – Head and Shoulders Breakdown: A Waterfall Effect AwaitTrade Idea: The Impending Shift from Bullish to Bearish Structure
EUR/USD has formed a classic Head and Shoulders pattern, a widely recognized reversal formation that signals the potential exhaustion of bullish momentum. The price is currently trading within a rising channel, but with the right shoulder already developed, a break below the channel support could trigger a waterfall sell-off, accelerating downside momentum.
Key Confirmation for Entry:
A break below the rising channel support and the neckline of the Head and Shoulders pattern will act as a strong trigger for bearish continuation.
Retesting this broken level as new resistance would offer an optimal shorting opportunity.
Entry Strategy:
Aggressive Entry: Enter short upon the initial break of channel support.
Conservative Entry: Wait for a retest of the broken structure before entering short.
Profit Targets:
First Target (TP1): 1.0400 – Psychological level and previous structural support.
Second Target (TP2): 1.0325 – Strong demand zone aligned with historical support.
Stop Loss:
Above the right shoulder at approximately 1.0560, to protect against potential false breakouts.
Risk Management:
Reduce exposure if price struggles to maintain bearish momentum.
Move stop loss to breakeven after securing TP1.
The potential waterfall effect is a result of trapped long positions facing forced liquidations once key support zones are breached. The combination of technical factors suggests that once the neckline gives way, selling pressure could intensify, leading to a sharp downside move. Stay alert for confirmation and execute accordingly! 🚨📉


EUR/USD Continues to Move Within an Uptrend ChannelHello traders, let’s explore EUR/USD today.
Today, FX:EURUSD continues to move within a clearly defined parallel channel. The pair is currently adjusting its trend and experiencing a slight decline around 1.0500, being limited by the previously marked resistance level.
Recent volatility has been driven by US economic data and Eurozone inflation expectations, making traders cautious. Additionally, the USD has strengthened following hawkish remarks from the Federal Reserve. However, buyers are still defending key technical levels in the EUR/USD pair.
From an objective standpoint, the pair has rejected resistance at the upper trendline twice, signaling a possible short-term retracement.
If EUR/USD retraces, it could retest the lower boundary of the trend channel near 1.0480, a key support zone where buyers previously stepped in. The EMA 34 and 89 remain in an uptrend, reinforcing the bullish structure.
As long as the channel structure holds and buyers continue to step in, the bullish trend remains intact.
What about you? Are you expecting an upside breakout, or do you anticipate a deeper pullback before further gains?

Title: GBP/USD Trading Plan – Key Levels & GfK Consumer Climate This morning at 8:00 AM (CET), I will be monitoring the GfK Consumer Climate data release in Germany.
For GBP/USD, my strategy is to buy pullbacks at 1.2585, with a deeper buy zone around 1.2540. On the upside, I will look to sell tests of the 1.2700 resistance level.
A retracement to 1.2540 seems highly probable in the coming days.


