#22 - EnertimeTrade opened today. Previous closed stocks trades : #1 : Air China : Position return : - 17.38 %. #21 : Freelance.com : Position return : - 2.36 %. ALongby RazorfishUpdated 111
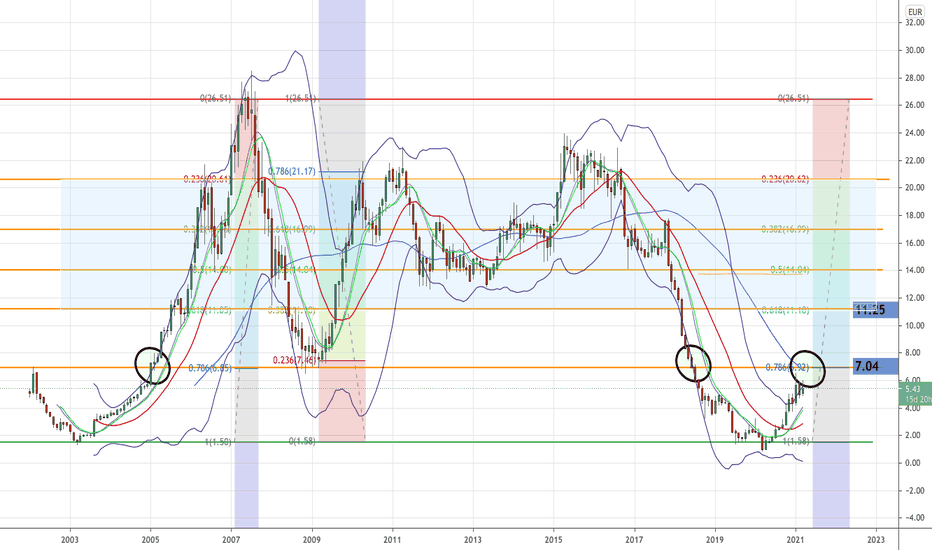
BeterBed. From 7.04 uptrend to 11.25.7.04 is the point where the uptrend can start. BLongby Rich_Exclusive_Trading0
Heijmans resistances 17, 21, 24, 28, 35At € 17 the Fib 0.618% actually starts. Than an uptrend to 21, 24, 28, 35 can start. Longby Rich_Exclusive_Trading0
ForFarmers huge potential from 7.20. Uptrend possible to 10.60After problems in 2019 as result of bad deals, the company has reached the bottom of 5.80. From 7.20 the trend can be broken and an uptrend can break out to the resistances as mentioned. Longby Rich_Exclusive_Trading0
EUTELSAT's new long term ascending channelI expect the price of Eutelsat will zigzag in the ascending channel for the foreseable future. Long positions may be entered when the RSI reaches it support line. Short positions may be taken when RSI is overbougth. Let me know what you think of this idea.by Jeff_Trad220
Sanofi consolidates, new bullish trend in 2022I expect the price of Sanofi to carry on falling inside the descending channel, especially if global market consolidates due to rising inflation fears. Sanofi has not been able to produce a covid vaccine and is just starting phase I/II trials for a second vaccine candidate which leaves the near future a bit blurry and may keep investors away. Once the price has reached the bottom of the horizontal range (64 EUR) I expect a reversal for a new bullish trend towards 95EUR by end of 2022.by Jeff_Trad0
OR News Analysis I predict with the best probability the future trends, my ideas are reserved for the experienced trader. #UniversTrader Longby UniversTrader1
Arcelor Mittal ready for a grow spurtBelieving that due to the different circumstances of the company the stocks could possibly keep rising with the postitive trend. by MGerrits1
Arcelor mittal (MT) back in old channelHi, Arcelor Mittal doubled from 10 to 20 in less than 4 months. The strong uptrend didn't make any correction, till it reached the upperband of the channel that is used to trade in. From that point it corrected perfectly fine to a decent Fibonacci level. What we see right now is that it seems to have bottomed at 16.85 levels. The DRSI looks oversold and the on balance volume is still moving upwards. MACD looks perfectly fine, which makes a trade possible. Entry: 16.85 - 17.88 Target: 21.50 Stoploss: 16.30 Longby Mouzy92Updated 224
Consolidation carries on in 2021, Growth in 2022I expect the price will carry on inside the descending channel in 2021 as the french market may soon face headwinds (rising inflation, rising treasury yields, global consolidation after long bullish trend). In addition Orange also recons difficulties ahead in 2021 to generate free cashflows, a situation likely to improve in 2022 according to the management. 2022 should also see the news feed improve (merger with Deutsch Telecom, IPO of telecom towers, development in Africa). Conditions will be better then to initiate a new growth on a rock solid basis (decade long support trendline). Let me know what you think of this in comment.by Jeff_Trad0
$UPGFalling wedge 4hr classic bullish divergence on the MACD and hidden bullish divergence on the RSI Daily hidden bullish divergence on the MACD and RSI Currently at the 0.618 fib retracement Making higher lows Oversold on the 4hr by Joshh_TradessUpdated 2
Fastned will possibly test 69.When the price breaks 84,6 this could become in downtrend. Shortby Rich_Exclusive_TradingUpdated 222
Downtrend ended, ready to goDowntrend is finished. RSI is suitable for an uptrend. Cup & handle formation got the confirmation, so? Ready to go. TP 4.25 SL 1.98 or follow blue trend line. Longby omurdenUpdated 0
Target 43.79Following 2 formations in weekly chart. I think ready to break downtrend Also there is a cup & handle formation. TP1 37.42 TP2 39.85 TP3 43.79 SL 25.46Longby omurdenUpdated 0
Medium risk opportunity ON VALBIOTIS!!On this unit of time, has the underlying uptrend run out of steam or is it lacking in power? The short term does not yet offer any information that would allow anticipating a resumption of the bullish movement or a correction. The hand is generally with the buyers even if a small correction (not treatable) on the support located at 6.63 EUR remains possible. You should trade VALBIOTIS with the greatest caution, while favoring long positions (to buy) as long as the price remains well above 6.63 EUR. The next bullish target for buyers is set at 7.72 EUR. A bullish breakout of this resistance would revive the bullish momentum. Buyers could then aim for resistance at 8.12 EUR. In the event of a breach, the next objective would be the resistance located at 8.50 EUR. In case of a downside breakout of the support located at 6.63 EUR we invite you to generate a new automatic technical analysis. Indeed, the conditions should have evolved. The price should certainly be more clearly bearish in the short term and the underlying uptrend in this unit of time would certainly be attenuated. by Ayoub4502
Sharing my thoughts and observations on SWIf this wave count is correct, we can expect a decline coming soon - subject to the respective technical confirmations as well...Shortby MarcoJarquin0
Sexy Price Action My elected setup showed up again and here I am to follow my rules and trust my edge. In this chart, I like particularlly the sexy price action change footprint. These two last bullish candles, lastest of which making a 31 bar high (wait for closure - I'm in a rush for Friday night beers, only entering next candly if things remain as is), have a profile drastically different form the past 30 candles. The bears had few or none interest in selling during the 58 day consolidation preceding this breakout. Plus, the bulls, in command, are awaken again. Analysis: 1. Stock in a uptrend - trading above 50 & just brokern out 200MA.We are hence looking for long opportunities; 2. Price close to a value zone - 50 MA. Now we have a reference to set our stoploss. 3. Trigger is this last big bullish candle breaking out a wedge pattern formed by the last 48 candles. Note: I would prefer of course a 50 MA slopping upwards more proeminently, but price action is is promising. Usual trade management + risk management rules. SYSTEM AVAILABLE @ easy-trades.blogspot.com Cheers, RR Longby ruben_rodrigues0
40 resistance broken, next is at 43.6Now the resistance 40 is broken we have a strong support and can test the next resistance of pre covid value 43.6 In my opinion, the oil stocks may enter in euphoria and FP is maybe only at the beggning of a rallye for spring.Longby jypay110