OPEN-SOURCE SCRIPT
Monthly Price Insights V1 [PINESCRIPTLABS]
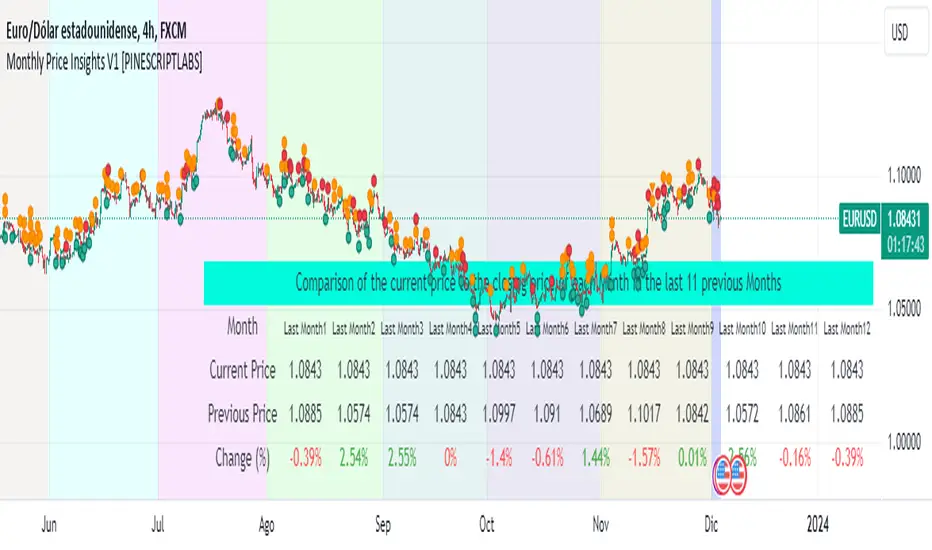
This indicator displays a chart table that compares the current price of the asset with the closing prices of the last 12 months. This table includes columns for the month, the current price, the previous price, and the percentage change.

Monthly Color Visualization: The indicator uses unique colors for each month, facilitating quick identification of the current and previous periods on the trading chart.

Calculation of Percentage Changes: The indicator calculates the percentage change in price from the previous month, providing a clear perspective on the price trend over time.
Dynamic Data Update: It automatically updates to reflect changes in the asset's price.

Español:
Este indicador muestra una tabla en el gráfico que compara el precio actual del activo con los precios de cierre de los últimos 12 meses. Esta tabla incluye columnas para el mes, el precio actual, el precio anterior y el cambio porcentual.
[imagen][/imagen]
Visualización por Colores Mensuales: El indicador utiliza colores únicos para cada mes, facilitando la identificación rápida del periodo actual y los anteriores en el gráfico de trading.
[imagen][/imagen]
Cálculo de Cambios Porcentuales: El indicador calcula el cambio porcentual en el precio desde el mes anterior, proporcionando una perspectiva clara de la tendencia del precio a lo largo del tiempo.
Actualización Dinámica de Datos: Se actualiza automáticamente para reflejar los cambios en el precio del activo.
[imagen][/imagen]
Monthly Color Visualization: The indicator uses unique colors for each month, facilitating quick identification of the current and previous periods on the trading chart.
Calculation of Percentage Changes: The indicator calculates the percentage change in price from the previous month, providing a clear perspective on the price trend over time.
Dynamic Data Update: It automatically updates to reflect changes in the asset's price.
Español:
Este indicador muestra una tabla en el gráfico que compara el precio actual del activo con los precios de cierre de los últimos 12 meses. Esta tabla incluye columnas para el mes, el precio actual, el precio anterior y el cambio porcentual.
[imagen]
Visualización por Colores Mensuales: El indicador utiliza colores únicos para cada mes, facilitando la identificación rápida del periodo actual y los anteriores en el gráfico de trading.
[imagen]
Cálculo de Cambios Porcentuales: El indicador calcula el cambio porcentual en el precio desde el mes anterior, proporcionando una perspectiva clara de la tendencia del precio a lo largo del tiempo.
Actualización Dinámica de Datos: Se actualiza automáticamente para reflejar los cambios en el precio del activo.
[imagen]
Open-source script
In true TradingView spirit, the creator of this script has made it open-source, so that traders can review and verify its functionality. Kudos to the author! While you can use it for free, remember that republishing the code is subject to our House Rules.
For quick access on a chart, add this script to your favorites — learn more here.
"Access our premium algorithms 🍻! Invite us for a beer at buymeacoffee.com/pinescriptlabs, then add your TradingView username in the 'Say something nice' section and send us a private message."
Disclaimer
The information and publications are not meant to be, and do not constitute, financial, investment, trading, or other types of advice or recommendations supplied or endorsed by TradingView. Read more in the Terms of Use.