OPEN-SOURCE SCRIPT
Updated PA Helper
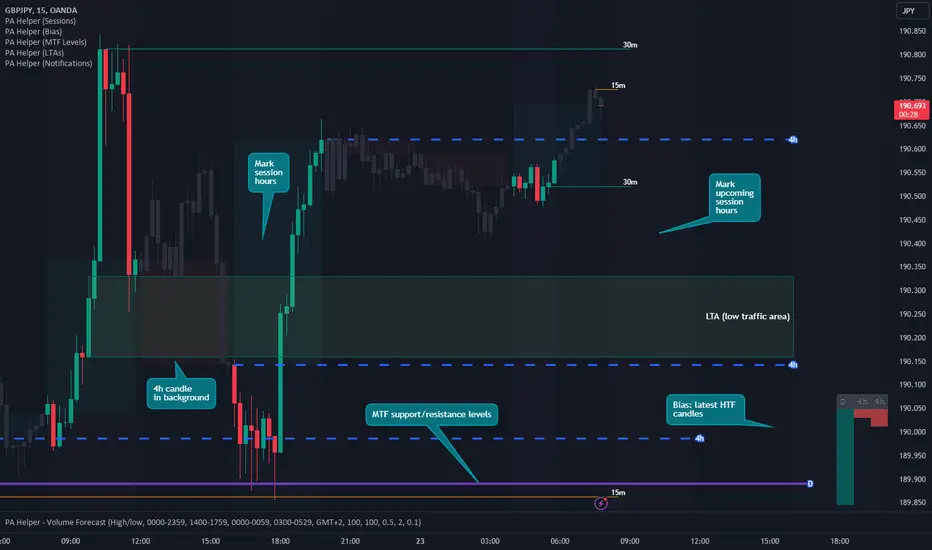
Provides a holistic view of key support and resistance levels across multiple timeframes. This versatile indicator allows traders to customize and configure timeframes, empowering them to make more informed decisions based on dynamic market conditions.
Configurable Timeframes:
Tailor your analysis to specific market scenarios by configuring the timeframes that matter most to your trading strategy. Whether focusing on short-term intraday movements or longer-term trends, this indicator adapts to your preferred time intervals.
Dynamic Support and Resistance Lines:
The indicator dynamically calculates and displays support and resistance lines based on the selected timeframes. This ensures that the analysis is responsive to changing market dynamics, providing a more accurate representation of potential reversal zones.
Color-Coded Lines:
Easily identify and differentiate between support and resistance lines with color-coded markings. This visual representation simplifies the interpretation of key price levels, enabling traders to make quicker and more confident trading decisions.
Aggregated Overview:
Gain a comprehensive understanding of support and resistance levels by viewing an aggregated overview of lines from different timeframes. This feature helps traders identify confluence zones, where multiple timeframes converge to strengthen a particular support or resistance level.
User-Friendly Interface:
The indicator boasts a user-friendly interface, making it accessible for traders of all experience levels. Effortlessly navigate through timeframes and settings, and quickly interpret the analysis for more effective decision-making.
The Multi-Timeframe Support and Resistance Lines indicator is a valuable asset for traders seeking a comprehensive and customizable tool to enhance their technical analysis. Whether employed for day trading, swing trading, or trend analysis, this indicator offers the flexibility and precision needed to navigate the complexities of the financial markets successfully.
Release Notes
Added bias candles relative depictionRelease Notes
We are excited to announce the latest update to our trading indicator, introducing significant enhancements to empower your technical analysis. In Version X.X.X, we have focused on providing a more comprehensive understanding of market sentiment by incorporating a snapshot feature for the latest daily and 4-hour candles.Key Features:
Daily Candle Snapshot:
The update introduces a configurable snapshot of the latest daily candle. Traders now have immediate access to crucial information, allowing for quick assessment of daily price movements.
4-Hour Candle Analysis:
In response to user feedback, we have expanded the functionality to include snapshots of the two most recent 4-hour candles, both fully configurable. This addition provides a more nuanced view of short-term trends, aiding in precise decision-making.
Session Bias Determination:
The new release facilitates a more informed understanding of the market by helping users identify the session bias. With the latest daily and 4-hour candle snapshots, traders can easily gauge whether the market sentiment is bullish, bearish, or mixed.
Configurability:
Recognizing the diverse needs of our user base, we have emphasized configurability. Traders can tailor the indicator to their specific preferences, choosing the timeframe for the daily candle snapshot and the number of 4-hour candles to analyze.
Enhanced Visual Representation:
We have refined the visual representation of the indicator to ensure a user-friendly experience. Clear and intuitive displays aid in quick interpretation of the market bias, promoting efficient decision-making.
Compatibility:
The updated indicator is seamlessly integrated into the TradingView platform, ensuring compatibility with your existing charts and analysis tools. Whether you are a seasoned trader or a novice, incorporating this update into your workflow is seamless.
How to Use:
Simply apply the updated indicator to your TradingView chart.
Configure the settings according to your preferences.
Utilize the daily and 4-hour candle snapshots to determine the session bias.
Conclusion:
With this update, we aim to provide traders with a powerful tool for refining their market analysis. The ability to quickly assess the latest daily and 4-hour candles empowers you to make well-informed decisions. As always, we value your feedback and are committed to enhancing your trading experience. Happy trading!
Release Notes
Added colored bias areasRelease Notes
- Improved levels detection- Improved bias area drawings
Release Notes
Added level/lines decongestion optionRelease Notes
Performance improvementsRelease Notes
Improved levels visibility (long running lines)Release Notes
Bias improvementsRelease Notes
Improved decongestionRelease Notes
Improve decongestion, performance and level detectionRelease Notes
Added a points multiplier feature for easier scalability of point values when the indicator is applied to different instrumentsRelease Notes
Beginning of theme supportRelease Notes
Added themesRelease Notes
Fixed a bug regarding level detections on the chart's timeframeRelease Notes
Performance improvements on higher timeframes, when fewer levels selected, and when bias & ranges deactivatedRelease Notes
Markup LTAsRelease Notes
Fixed array errorRelease Notes
Improved LTA displayRelease Notes
Cosmetic UpdatesLTA improvements
Release Notes
Improve sessions displayRelease Notes
Automatic bias proposalsRelease Notes
Added option to hide lines, labelsRelease Notes
Improved level decongestionRelease Notes
LTA filteringRelease Notes
Focus Alerts:By providing customizable Focus Alerts at specified intervals, this addition aids traders in efficient time management.
The feature allows traders to focus on the charts only during the specified elapsed intervals, minimizing the need for constant monitoring
- Alert Text: You can set a customizable message for each focus alert.
- Focus Start: Specifies the starting date and time for the focus alerts.
- Alert Interval: Allows you to choose the time interval for repeated focus alerts.
- Respect Sessions: An option to respect session times for focus alerts.
The indicator utilizes the alert function to trigger alerts based on the specified conditions.
Alerts are triggered at the specified intervals starting from the provided focus start date and time.
The indicator respects session times, and the alert will trigger at most once per bar.
Release Notes
UI improvementsRelease Notes
Fixed focus alerts during session timesRelease Notes
Performance improvementsRelease Notes
Allow multiple focus alerts per barRelease Notes
Added possibility of alert when price closes below/aboveRelease Notes
- Added Session Start/End notifications
- Improved price closure notifications
Release Notes
Notifications On Close Above/Below Marked LevelsRelease Notes
- Added advanced alerts
- Added support on Discord
Release Notes
UI adjustmentRelease Notes
Added max levels per TF optionRelease Notes
UI improvements: remove unnecessary info from the status lineRelease Notes
Extra marking fresh/tapped levelsRelease Notes
Added option to show level pricesRelease Notes
Option to hide candles outside session hoursRelease Notes
Fixed LTA displayRelease Notes
Adding an option for LTA alertsRelease Notes
- Added option to alert on bias change
- UI improvements
Release Notes
Ability to name the instance of the indicator (useful when applied multiple times with different settings on the same chart)Release Notes
Improving performance when decongestion is offRelease Notes
LTA detection fixesRelease Notes
Added levels heatmapRelease Notes
Added level score (strongness) - An indication of how strong a certain support/resistance is, based on what other levels are nearby in the same price zoneRelease Notes
Added support for psychological levels: key round price numbers (customizable) where price may bounce fromRelease Notes
Added "All distinct levels" as a decongestion optionRelease Notes
Templates supportRelease Notes
Customizable Heatmap colorsRelease Notes
Added more Heatmap sizes customizationRelease Notes
Added option to group levels that are common on multiple timeframesRelease Notes
Grouping levels bugfixesRelease Notes
Added option to choose up to how many levels to concatenate while grouping common levels on multiple timeframesRelease Notes
Now displaying the custom alert levels on the chart, together with their custom notesRelease Notes
Fixed small issues and slightly improved performanceRelease Notes
Allowing decongestion for Levels templatesRelease Notes
Slight performance improvementsRelease Notes
Separated the concept of LTA (Low Traffic Area) and NTA (No Traffic Area) - available in templatesRelease Notes
Added lookback period option to increase performanceRelease Notes
Improved UI and heatmapRelease Notes
Added additional help text, clarifying decongestionRelease Notes
Improved settings UI and heatmap displayRelease Notes
Added the option of persisting the heatmapRelease Notes
New option: highlight gaps(only visible on brokers/charts that are not smoothing candles)
Release Notes
Added the option to show/hide historical gapsAdded a version date to ensure you always have the latest version of the indicator
Release Notes
Added the option to smooth candles.Note: the original candles should stay hidden in order to view only the indicator's candles
Release Notes
Added option to highlight the candles that have no wicksRelease Notes
Renamed NTA (no traffic area) to LTA (low traffic area). LTA is the area between levels on the current timeframe
NTA is the area between any levels on any timeframe (more restrictive than LTA)
Release Notes
Improved tooltip help texts amd guidanceRelease Notes
- Improved UI
- Improved level decongestion (prioritizing older levels)
- Improved light theme
Release Notes
Displaying levels with S/R (support/resistance) suffixesRelease Notes
- Added experimental feature: contention price (levels where price had difficulties of advancing in the past)
- Simplified UI
Release Notes
Introducing levels count per zone: shows the number of all multi timeframe levels that were historically formed, grouped in zones of a custom sizeRelease Notes
Add the option to filter the notifications of closing above/below selected timeframes based on bias: notify a close above on bullish bias, notify a close below on bearish biasRelease Notes
UI improvements & simplificationRelease Notes
Added the option of showing notification flags whenever an alert is supposed to be triggered (useful for observing past data and movements)Release Notes
UI improvements and better small fixes regarding levels groupingRelease Notes
Added the option of showing when levels were created (for those levels that are old)Release Notes
Improved level creation date display (not showing hours when it's not relevant)Fixed level detection regression
Release Notes
Improved level detectionRelease Notes
Improved psychological key level detectionRelease Notes
Visual feature: only display the lines (no text) for levels that already had their timeframe describedRelease Notes
Bias now taking into account gaps, virtually smoothing candlesRelease Notes
Simplified bias: displaying only the last 2 HTF candles (e.g. previous D and previous 4h), instead of 3 candlesRelease Notes
Improved loading performance and applying max-lookback to smoothed candlesRelease Notes
Lighter smooth candles template (not including gaps & no-wick highlights)Recent lookback is now set to 2000 bars
Release Notes
Option to ghost out the current candle so that it's not influencing decisions before it closesRelease Notes
Considering wicks as ½ of a passthroughRelease Notes
Removed some unnecessary options: showing fresh levels and the level's creation date/timeRelease Notes
Removed customizable size for LTAs to avoid options clutterRelease Notes
- improved level grouping- added option to show/hide level types
Release Notes
Downgraded to a lite version, only concentrated on support/resistances (multi timeframe), bias, smooth candles, opening hours and notifications.Out of support as of today.
For the fully fledged and maintained indicator, please check

Open-source script
In true TradingView spirit, the creator of this script has made it open-source, so that traders can review and verify its functionality. Kudos to the author! While you can use it for free, remember that republishing the code is subject to our House Rules.
For quick access on a chart, add this script to your favorites — learn more here.
Privately maintained PA Helper indicator:
tradingview.com/script/YXOUXW17-PAH/
Join Discord group for Q&A, support, requests, suggestions and/or general trading discussions:
discord.gg/CKuzmFaTKs
tradingview.com/script/YXOUXW17-PAH/
Join Discord group for Q&A, support, requests, suggestions and/or general trading discussions:
discord.gg/CKuzmFaTKs
Disclaimer
The information and publications are not meant to be, and do not constitute, financial, investment, trading, or other types of advice or recommendations supplied or endorsed by TradingView. Read more in the Terms of Use.