PROTECTED SOURCE SCRIPT
Px & Vol Up/Dn Ratio with MA
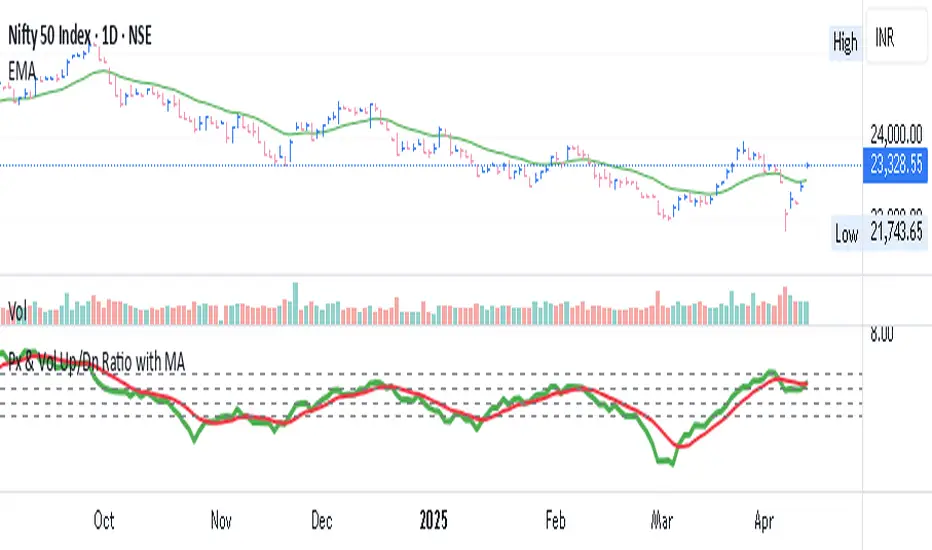
Px & Vol Up/Down Ratio with Moving Average
This custom indicator calculates the Price Up/Down Ratio and Volume Up/Down Ratio over a user-defined lookback period. It provides a unique perspective on market strength by comparing the magnitude of gains vs. losses (in both price and volume) — helping traders gauge the underlying momentum and accumulation/distribution behavior.
🔍 Core Features:
Price Ratio: Total positive price change divided by the absolute value of total negative price change.
Volume Ratio: Total volume on up days divided by total volume on down days.
Moving Average Overlay: Smooth each ratio with your choice of moving average — SMA, EMA, or WMA.
Customizable lookback period and moving average length for flexible analysis.
🧭 Use Case:
A rising Price Ratio above 1 indicates stronger positive price action than negative.
A rising Volume Ratio above 1 suggests increased participation on up moves — a sign of accumulation.
Divergences between Price and Volume ratios can provide early clues on trend reversals or weakening momentum.
🧱 Visual Aids:
Includes six key horizontal reference lines at levels: 0.5, 0.75, 1, 1.25, 1.5, 2 to benchmark current ratio strength.
Color-coded plots for clarity:
Blue for Price Ratio
Green for Volume Ratio
Protected script
This script is published as closed-source. However, you can use it freely and without any limitations – learn more here.
Disclaimer
The information and publications are not meant to be, and do not constitute, financial, investment, trading, or other types of advice or recommendations supplied or endorsed by TradingView. Read more in the Terms of Use.