OPEN-SOURCE SCRIPT
SMA Cross Dashboard | Flux Charts
💎 GENERAL OVERVIEW
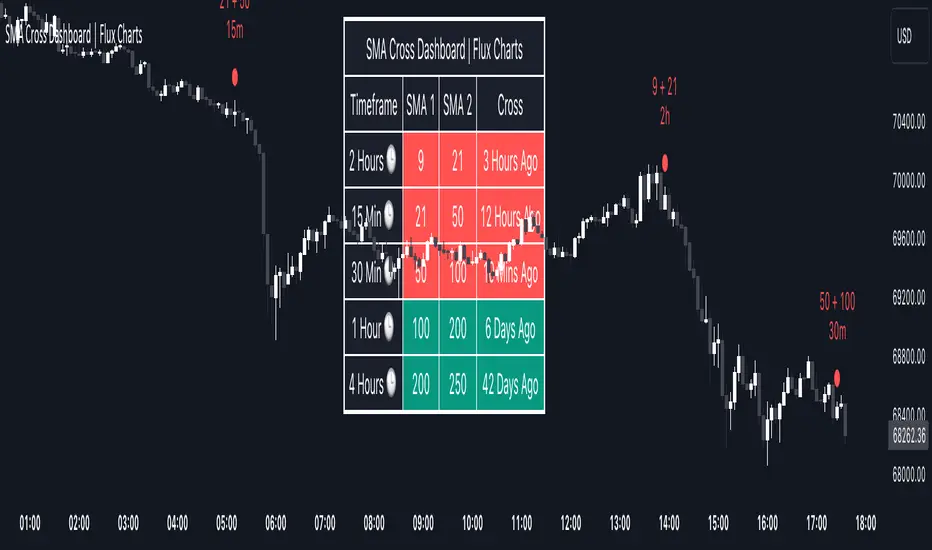
Introducing our new Simple Moving Average (SMA) Cross Dashboard! This dashboard let's you select a source for the calculation of the SMA of it, then let's you enter 2 lengths for up to 5 timeframes, plotting their crosses in the chart.

Features of the new SMA Cross Dashboard :
📌 HOW DOES IT WORK ?
SMA is a widely used indicator within trading community, it simply works by taking the mathematical average of a source by desired length. Crosses of SMA lines can be helpful to determine strong bullish & bearish movements of an asset. This indicator shows finds crosses across 5 different timeframes in a dashboard and plots them in your chart for ease of use.

🚩UNIQUENESS
This dashboard cuts through the hassle of manual SMA cross calculations and plotting. It offers flexibility by allowing various data sources (even custom indicators) and customization through enabling / disabling individual timeframes. The clear visualization lets you see SMA crosses efficiently.
⚙️SETTINGS
1. Timeframes
You can set up to 5 timeframes & 2 lenghts to detect crosses for each timeframe here. You can also enable / disable them.
2. General Configuration
SMA Source -> You can select the source for the calculation of the SMA here. You can select sources from other indicators as well as more general sources like close, high and low price.
Introducing our new Simple Moving Average (SMA) Cross Dashboard! This dashboard let's you select a source for the calculation of the SMA of it, then let's you enter 2 lengths for up to 5 timeframes, plotting their crosses in the chart.
Features of the new SMA Cross Dashboard :
- Shows SMA Crosses Across Up To 5 Different Timeframes.
- Select Any Source, Including Other Indicators.
- Customizable Dashboard.
📌 HOW DOES IT WORK ?
SMA is a widely used indicator within trading community, it simply works by taking the mathematical average of a source by desired length. Crosses of SMA lines can be helpful to determine strong bullish & bearish movements of an asset. This indicator shows finds crosses across 5 different timeframes in a dashboard and plots them in your chart for ease of use.
🚩UNIQUENESS
This dashboard cuts through the hassle of manual SMA cross calculations and plotting. It offers flexibility by allowing various data sources (even custom indicators) and customization through enabling / disabling individual timeframes. The clear visualization lets you see SMA crosses efficiently.
⚙️SETTINGS
1. Timeframes
You can set up to 5 timeframes & 2 lenghts to detect crosses for each timeframe here. You can also enable / disable them.
2. General Configuration
SMA Source -> You can select the source for the calculation of the SMA here. You can select sources from other indicators as well as more general sources like close, high and low price.
Open-source script
In true TradingView spirit, the creator of this script has made it open-source, so that traders can review and verify its functionality. Kudos to the author! While you can use it for free, remember that republishing the code is subject to our House Rules.
Access Flux Charts' exclusive indicators: FluxCharts.com/?via=tv
Join our FREE Discord for live trading sessions, signals, & trading resources: discord.gg/FluxCharts
Join our FREE Discord for live trading sessions, signals, & trading resources: discord.gg/FluxCharts
Disclaimer
The information and publications are not meant to be, and do not constitute, financial, investment, trading, or other types of advice or recommendations supplied or endorsed by TradingView. Read more in the Terms of Use.