OPEN-SOURCE SCRIPT
Straddle Indicator - Padding Guide
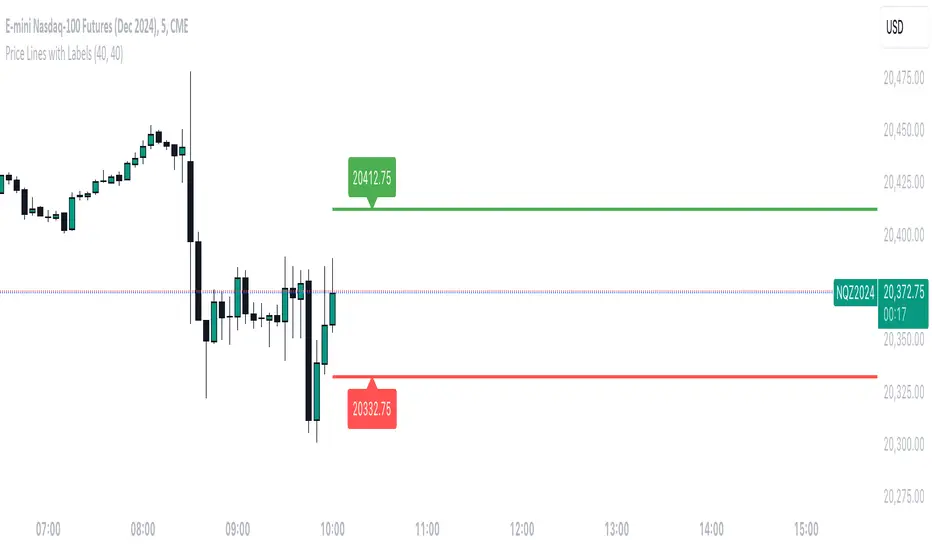
The Straddle Indicator is designed to help traders visualize potential market movements by straddling the current price. This indicator draws two horizontal lines on the chart: one positioned above and one below the current price, based on user-defined offsets.
Key Features:
Dynamic Price Levels: The levels are calculated based on the current closing price, allowing the indicator to adapt to changing market conditions in real time.
Customizable Offsets: Traders can customize the offsets for the lines above and below the current price, providing flexibility to align with their trading strategies or market analysis.
Visual Clarity: The indicator displays the price levels as horizontal lines in distinct colors (green for above and red for below) along with corresponding labels showing the exact price levels, facilitating quick reference.
Current Bar Focus: The lines and labels are updated to only reflect the current bar, minimizing chart clutter and making it easy to focus on the most relevant price action.
This indicator is particularly useful for traders employing straddle strategies, as it helps to anticipate potential price movements and plan entries or exits accordingly.
Open-source script
In true TradingView spirit, the creator of this script has made it open-source, so that traders can review and verify its functionality. Kudos to the author! While you can use it for free, remember that republishing the code is subject to our House Rules.
Disclaimer
The information and publications are not meant to be, and do not constitute, financial, investment, trading, or other types of advice or recommendations supplied or endorsed by TradingView. Read more in the Terms of Use.