OPEN-SOURCE SCRIPT
Muyyu oscillator
Updated
Muyyu oscillator(MO) is a combination of price based momentum and volume based momentum. MO consist of two things which is MO line and MO bar.
MO Line can be used to identify overbought and oversold situations. However, it is important to know when to look for overbought readings and when to look for oversold readings. As with most momentum oscillators, it is best to look for short-term oversold situations when the medium-term trend is up and short-term overbought situations when the medium-term trend is down. In other words, look for opportunities in the direction of the bigger trend, such as a pullback within a bigger uptrend. Define the bigger trend before looking for overbought or oversold readings.
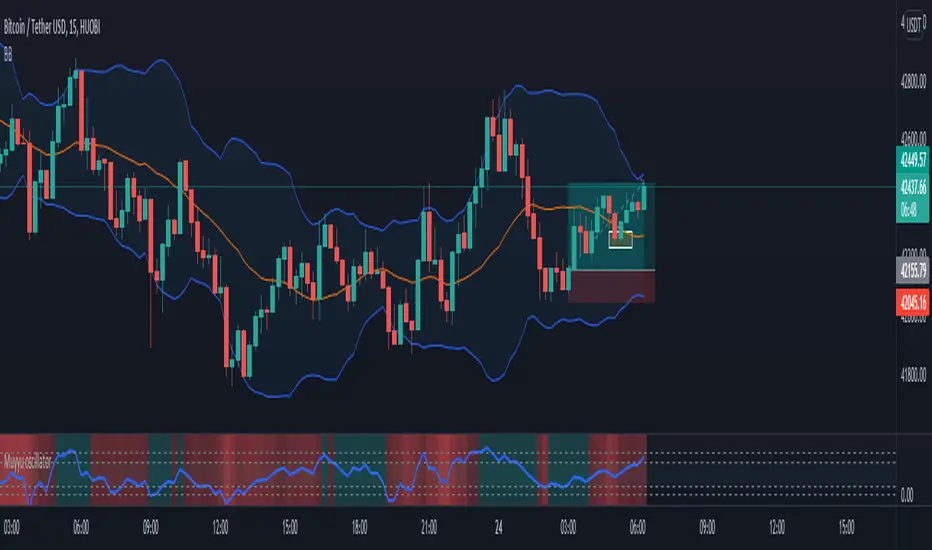
MO Line quantifies the relationship between price and Bollinger Band. Readings above .80 indicate that price is near the upper band. Readings below .20 indicate that price is near the lower band. Surges towards the upper band show strength, but can sometimes be interpreted as overbought(divergence). Plunges to the lower band show weakness, but can sometimes be interpreted as oversold(Divergence). A lot depends on the underlying trend and other indicators. While MO Line can have some value on its own, it is best when used in conjunction with other indicators or price analysis.
MO Line = (Price - Lower Band)/(Upper Band - Lower Band)
The default setting for MO Line is (21,2). The bands are set 2 standard deviations above and below the 21-day simple moving average.
MO bar is a Money Flow Index(MFI) divide by 100.
MFI is a momentum indicator that measures the flow of money into and out of a security over a specified period of time. It is related to the Relative Strength Index (RSI) but incorporates volume, whereas the RSI only considers price. The MFI is calculated by accumulating positive and negative Money Flow values, then creating a Money Ratio. The Money Ratio is then normalized into the MFI oscillator form.
Combine this two to find where you will find a perfect entry for trend following. For example ;
a trend-following system using MO line with the MO bar. An uptrend begins when MO line is above 1 and MO bar is above 0.8(green bar). MO bar is bound between zero and one. A move above .80 places MO bar in the upper 20% of its range, which is a strong reading. Downtrends are identified when MO line is below 0 and MO bar is below 0.2.
MO Line can be used to identify overbought and oversold situations. However, it is important to know when to look for overbought readings and when to look for oversold readings. As with most momentum oscillators, it is best to look for short-term oversold situations when the medium-term trend is up and short-term overbought situations when the medium-term trend is down. In other words, look for opportunities in the direction of the bigger trend, such as a pullback within a bigger uptrend. Define the bigger trend before looking for overbought or oversold readings.
MO Line quantifies the relationship between price and Bollinger Band. Readings above .80 indicate that price is near the upper band. Readings below .20 indicate that price is near the lower band. Surges towards the upper band show strength, but can sometimes be interpreted as overbought(divergence). Plunges to the lower band show weakness, but can sometimes be interpreted as oversold(Divergence). A lot depends on the underlying trend and other indicators. While MO Line can have some value on its own, it is best when used in conjunction with other indicators or price analysis.
MO Line = (Price - Lower Band)/(Upper Band - Lower Band)
The default setting for MO Line is (21,2). The bands are set 2 standard deviations above and below the 21-day simple moving average.
MO bar is a Money Flow Index(MFI) divide by 100.
MFI is a momentum indicator that measures the flow of money into and out of a security over a specified period of time. It is related to the Relative Strength Index (RSI) but incorporates volume, whereas the RSI only considers price. The MFI is calculated by accumulating positive and negative Money Flow values, then creating a Money Ratio. The Money Ratio is then normalized into the MFI oscillator form.
Combine this two to find where you will find a perfect entry for trend following. For example ;
a trend-following system using MO line with the MO bar. An uptrend begins when MO line is above 1 and MO bar is above 0.8(green bar). MO bar is bound between zero and one. A move above .80 places MO bar in the upper 20% of its range, which is a strong reading. Downtrends are identified when MO line is below 0 and MO bar is below 0.2.
Release Notes
New version of this pine script is using the Volume indicator directly instead of money flow index, which mean more accurate in term of readingRelease Notes
More accurate calculation and easy to eyesRelease Notes
This updated version is using the price momentum to define oversold and overbought situation with addition of price to volume ratio to define the 'REAL' overbought or oversold ratio. Buy only when the indicator are oversold and have green color. green color occur when the price to volume ratio are above 0 and below it, indicator will change to red color. sell when the indicator show red colour at overbought. Price to volume ratio is calculated by using formula = ((2*close)-high-low)/(high-low)*volume.
Price to volume ratio is to find how much volume influence the market price.
Release Notes
This updated version is using the price momentum to define oversold and overbought situation with addition of price to volume ratio to define the 'REAL' overbought or oversold situation. Buy only when the indicator are oversold and have green color. Sell when the indicator show red colour at overbought.Price to volume ratio is calculated by using formula = ((2*close)-high-low)/(high-low)*volume.
Price to volume ratio is to find how much volume influence the market price. green color occur when the price to volume ratio are above 0 and below it, indicator will change to red color. overbought level is 0.2 and oversold level is 0.8
Open-source script
In true TradingView spirit, the author of this script has published it open-source, so traders can understand and verify it. Cheers to the author! You may use it for free, but reuse of this code in publication is governed by House rules. You can favorite it to use it on a chart.
Disclaimer
The information and publications are not meant to be, and do not constitute, financial, investment, trading, or other types of advice or recommendations supplied or endorsed by TradingView. Read more in the Terms of Use.