OPEN-SOURCE SCRIPT
Consolidation Channels (AstroHub)

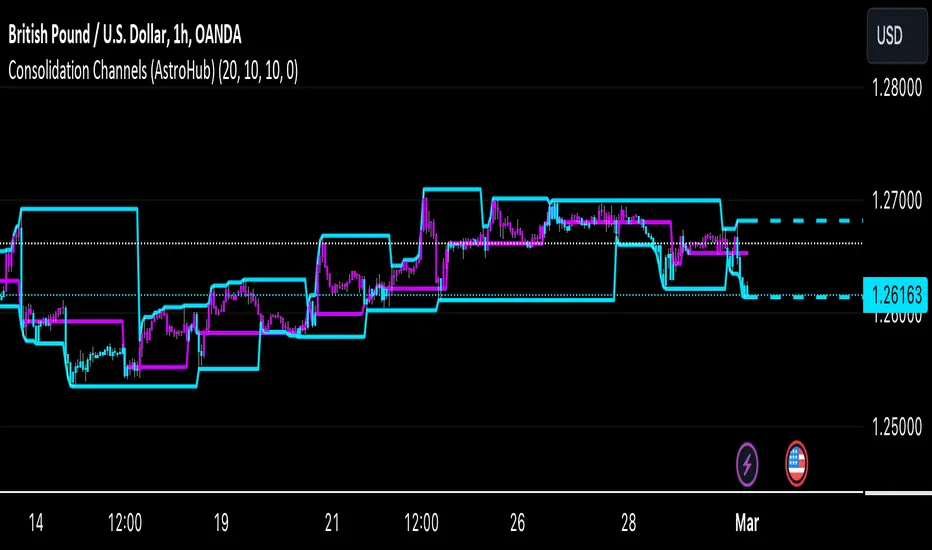
Consolidation Channels (AstroHub) Indicator
Overview:
The Consolidation Channels (AstroHub) indicator is a powerful tool designed for traders seeking to identify consolidation periods within financial markets. Unlike traditional indicators that merely follow trends or focus on specific trading strategies, this script utilizes a unique approach based on fractal dimension calculations and multidimensional momentum analysis to detect consolidation zones in price action.
Key Concepts:
Fractal Dimension (Di):
The script employs the concept of fractal dimension to define the consolidation period (N). The user can customize this parameter to adjust the sensitivity of the indicator to consolidation patterns.
Multidimensional Momentum (M):
Multidimensional momentum is calculated by assessing the interaction between the closing prices (Pi) and opening prices (Pj) over a specified period (T). This dynamic calculation provides a comprehensive view of momentum changes in the market.
Consolidation Start:
The indicator marks the beginning of consolidation by identifying the lowest point in the multidimensional momentum. The consolidation start line is displayed on the chart, providing a clear reference for traders.
High and Low Lines:
High and low lines are drawn from the highest and lowest price levels over the consolidation period. These lines help visualize the upper and lower bounds of the consolidation channel.
Bar Color Change:
The color of each bar changes based on whether the closing price is above or below the consolidation start line. This visual cue assists traders in quickly identifying shifts in market dynamics.
Dashed Lines into the Future:
Dashed lines extending into the future from the high and low points of consolidation provide a forward-looking perspective, aiding traders in anticipating potential price movements.


How to Use:
Customization:
Adjust the input parameters (N, r, T, Z, Color1, Color2, Color3) to suit your trading preferences and market conditions.
Interpretation:
Look for periods where the bar color changes, indicating shifts in market sentiment during consolidation. Pay attention to the start of consolidation, high, and low lines for potential reversal or breakout signals.
Alerts:
Set up alerts for key events such as reaching the lowest point, closing above the high line, or closing below the low line to stay informed about potential trading opportunities.
Conclusion:
The Consolidation Channels (AstroHub) indicator goes beyond conventional trend-following techniques, offering traders a unique perspective on market consolidation. By combining fractal dimension analysis and multidimensional momentum calculations, this script equips traders with a valuable tool for identifying potential reversal zones and making informed trading decisions.
Overview:
The Consolidation Channels (AstroHub) indicator is a powerful tool designed for traders seeking to identify consolidation periods within financial markets. Unlike traditional indicators that merely follow trends or focus on specific trading strategies, this script utilizes a unique approach based on fractal dimension calculations and multidimensional momentum analysis to detect consolidation zones in price action.
Key Concepts:
Fractal Dimension (Di):
The script employs the concept of fractal dimension to define the consolidation period (N). The user can customize this parameter to adjust the sensitivity of the indicator to consolidation patterns.
Multidimensional Momentum (M):
Multidimensional momentum is calculated by assessing the interaction between the closing prices (Pi) and opening prices (Pj) over a specified period (T). This dynamic calculation provides a comprehensive view of momentum changes in the market.
Consolidation Start:
The indicator marks the beginning of consolidation by identifying the lowest point in the multidimensional momentum. The consolidation start line is displayed on the chart, providing a clear reference for traders.
High and Low Lines:
High and low lines are drawn from the highest and lowest price levels over the consolidation period. These lines help visualize the upper and lower bounds of the consolidation channel.
Bar Color Change:
The color of each bar changes based on whether the closing price is above or below the consolidation start line. This visual cue assists traders in quickly identifying shifts in market dynamics.
Dashed Lines into the Future:
Dashed lines extending into the future from the high and low points of consolidation provide a forward-looking perspective, aiding traders in anticipating potential price movements.
How to Use:
Customization:
Adjust the input parameters (N, r, T, Z, Color1, Color2, Color3) to suit your trading preferences and market conditions.
Interpretation:
Look for periods where the bar color changes, indicating shifts in market sentiment during consolidation. Pay attention to the start of consolidation, high, and low lines for potential reversal or breakout signals.
Alerts:
Set up alerts for key events such as reaching the lowest point, closing above the high line, or closing below the low line to stay informed about potential trading opportunities.
Conclusion:
The Consolidation Channels (AstroHub) indicator goes beyond conventional trend-following techniques, offering traders a unique perspective on market consolidation. By combining fractal dimension analysis and multidimensional momentum calculations, this script equips traders with a valuable tool for identifying potential reversal zones and making informed trading decisions.
Open-source script
In true TradingView spirit, the author of this script has published it open-source, so traders can understand and verify it. Cheers to the author! You may use it for free, but reuse of this code in publication is governed by House rules. You can favorite it to use it on a chart.
Disclaimer
The information and publications are not meant to be, and do not constitute, financial, investment, trading, or other types of advice or recommendations supplied or endorsed by TradingView. Read more in the Terms of Use.