OPEN-SOURCE SCRIPT
Updated VIX Oscillator
This is my VIX Oscillator indicator.
About it:
This indicator takes the Z-Score of the VIX and of the current ticker you are on and presents them in the format of an oscillator.
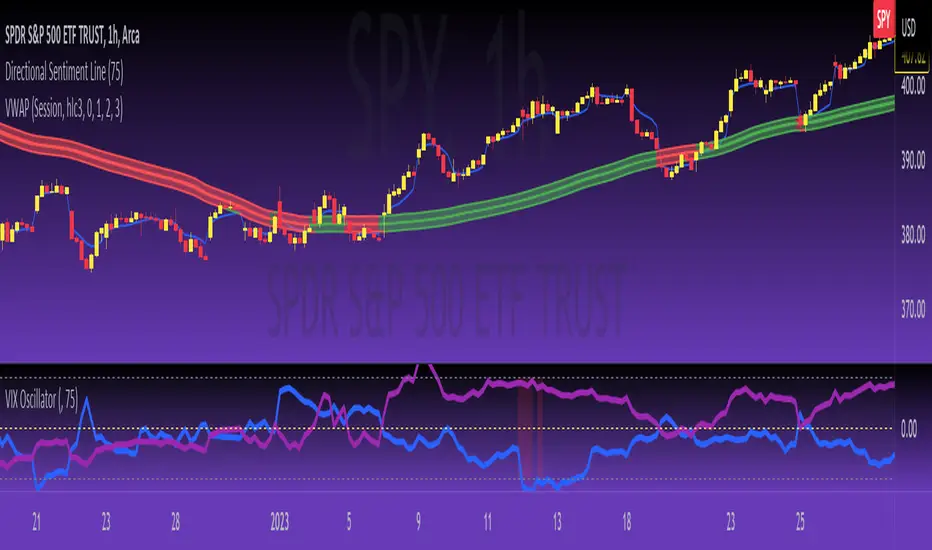
Key parts of the indicator:

A diagram of the key elements of the indicator are displayed above.
Purple Line: Represents the Z-Score of the current Ticker.
Blue Line: Represents the Z-Score of the VIX
Green fill line: Represents bullish divergence
Red fill line: Represents bearish divergence
How to use it:
Characteristics for long entries:

- Look for recent bullish divergence (green fill line)
- Look for the ticker line (purple line) to be holding above 0 (neutrality)
- look for a bullish cross (purple line (ticker) crossing over blue line (VIX))
Characteristics for short entries:

- Look for recent Bearish divergence
- Look for the VIX line (blue line) to be holding above 0 and the Ticker
- Look for the ticker line to be holding below 0
- Look for a bearish cross (blue crossing above purple)
Some principles:
The bands represent oversold, overbought and neutral.
0 is absolute neutrality. No bias here.
Anything towards + 2.5 is considered normal, moving towards overbought (2.5 or higher).
Anything towards -2.5 is considered normal, moving towards oversold (-2.5 or lower).
+2.5 or higher is overbought.
-2.5 or lower is oversold.
As always, I have prepared a quick tutorial video for your reference of this indicator:

Please let me know your questions, comments or suggestions about this indicator below.
Thank you for checking it out!
About it:
This indicator takes the Z-Score of the VIX and of the current ticker you are on and presents them in the format of an oscillator.
Key parts of the indicator:
A diagram of the key elements of the indicator are displayed above.
Purple Line: Represents the Z-Score of the current Ticker.
Blue Line: Represents the Z-Score of the VIX
Green fill line: Represents bullish divergence
Red fill line: Represents bearish divergence
How to use it:
Characteristics for long entries:
- Look for recent bullish divergence (green fill line)
- Look for the ticker line (purple line) to be holding above 0 (neutrality)
- look for a bullish cross (purple line (ticker) crossing over blue line (VIX))
Characteristics for short entries:
- Look for recent Bearish divergence
- Look for the VIX line (blue line) to be holding above 0 and the Ticker
- Look for the ticker line to be holding below 0
- Look for a bearish cross (blue crossing above purple)
Some principles:
The bands represent oversold, overbought and neutral.
0 is absolute neutrality. No bias here.
Anything towards + 2.5 is considered normal, moving towards overbought (2.5 or higher).
Anything towards -2.5 is considered normal, moving towards oversold (-2.5 or lower).
+2.5 or higher is overbought.
-2.5 or lower is oversold.
As always, I have prepared a quick tutorial video for your reference of this indicator:
Please let me know your questions, comments or suggestions about this indicator below.
Thank you for checking it out!
Release Notes
Quick update so that the indicator defaults to the chart. I know this caused some confusion.Also defaults to the 75 timeframe.
The 2 timeframes I use for intra-day trading is 14 and 75. I find the 75 less "noisy".
The timeframe I use for large analysis (1 hour and Daily) tends to be the 14.
Experiment as you like :-).
Release Notes
Cleaned up coding. No functional change.Release Notes
Updated based on user feedback.Now permits setting alert conditions for Bearish and Bullish instances.
Bullish = VIX is overbought (Z-Score >= 2.5) and Ticker is oversold (Z-Score <= -2.5)
Bearish = VIX is oversold (Z-Score >= -2.5) and Ticker is overbought (Z-Score <= 2.5)
Cleaned up the coding as well.
Open-source script
In true TradingView spirit, the creator of this script has made it open-source, so that traders can review and verify its functionality. Kudos to the author! While you can use it for free, remember that republishing the code is subject to our House Rules.
For quick access on a chart, add this script to your favorites — learn more here.
Easter sale starts April 18th for 50% off!
Get:
- Live Updates,
- Discord access,
- Access to my Proprietary Merlin Software,
- Access to premium indicators,
patreon.com/steversteves
Get:
- Live Updates,
- Discord access,
- Access to my Proprietary Merlin Software,
- Access to premium indicators,
patreon.com/steversteves
Disclaimer
The information and publications are not meant to be, and do not constitute, financial, investment, trading, or other types of advice or recommendations supplied or endorsed by TradingView. Read more in the Terms of Use.