OPEN-SOURCE SCRIPT
Updated Hammers
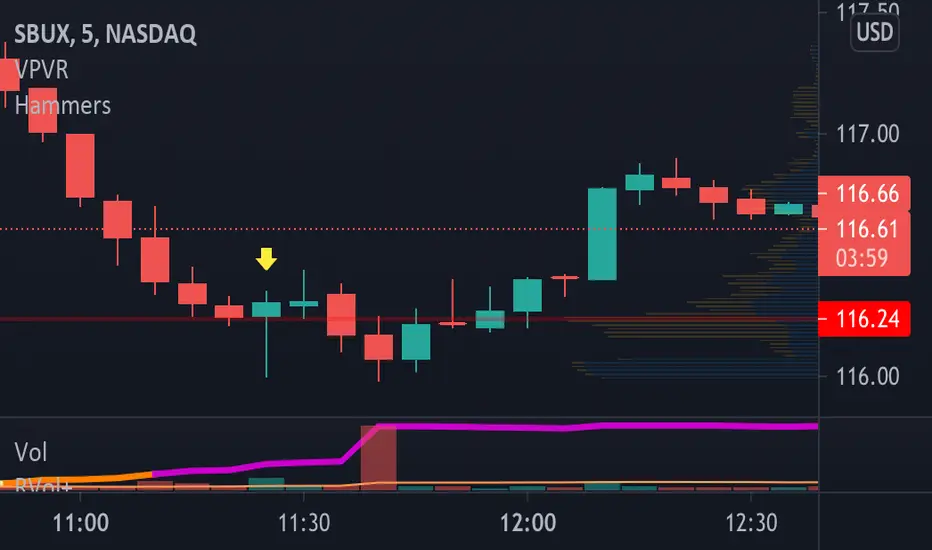
Plots an arrow above a hammer candle or candle with big lower wick. Yellow signifies a candle with higher than average volume. Blue is a lower than average volume candle. Hammers/Lower Wick candles are best after a drop in price or near bottoms.
Release Notes
Previously was only marking hammers that had a larger range than the previous candle. Now marking all hammers. If range is less than previous candle, indicator is on bottom of candle. If range is greater than previous candle, indicator is on top of candle.Release Notes
Updated name.Release Notes
Updated how top wick is compared to candle.Open-source script
In true TradingView spirit, the creator of this script has made it open-source, so that traders can review and verify its functionality. Kudos to the author! While you can use it for free, remember that republishing the code is subject to our House Rules.
For quick access on a chart, add this script to your favorites — learn more here.
Disclaimer
The information and publications are not meant to be, and do not constitute, financial, investment, trading, or other types of advice or recommendations supplied or endorsed by TradingView. Read more in the Terms of Use.
Open-source script
In true TradingView spirit, the creator of this script has made it open-source, so that traders can review and verify its functionality. Kudos to the author! While you can use it for free, remember that republishing the code is subject to our House Rules.
For quick access on a chart, add this script to your favorites — learn more here.
Disclaimer
The information and publications are not meant to be, and do not constitute, financial, investment, trading, or other types of advice or recommendations supplied or endorsed by TradingView. Read more in the Terms of Use.