▋ INTRODUCTION :
The “Index Generator” simplifies the process of building a custom market index, allowing investors to enter a list of preferred holdings from global securities. It aims to serve as an approach for tracking performance, conducting research, and analyzing specific aspects of the global market. The output will include an index value, a table of holdings, and chart plotting, providing a deeper understanding of historical movement.
_______________________
▋ OVERVIEW:

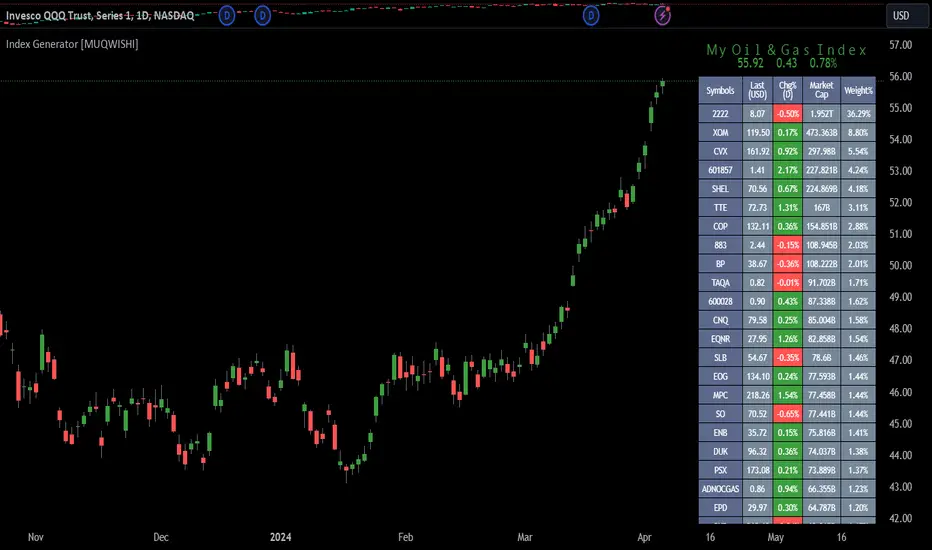
The image can be taken as an example of building a custom index. I created this index and named it “My Oil & Gas Index”. The index comprises several global energy companies. Essentially, the indicator weights each company by collecting the number of shares and then computes the market capitalization before sorting them as seen in the table.
_______________________
▋ OUTPUTS:
The output can be divided into 3 sections:
1. Index Title (Name & Value).
2. Index Holdings.
3. Index Chart.

1. Index Title, displays the index name at the top, and at the bottom, it shows the index value, along with the daily change in points and percentage.

2. Index Holdings, displays list the holding securities inside a table that contains the ticker, price, daily change %, market cap, and weight %. Additionally, a tooltip appears when the user passes the cursor over a ticker's cell, showing brief information about the company, such as the company's name, exchange market, country, sector, and industry.

3. Index Chart, display a plot of the historical movement of the index in the form of a bar, candle, or line chart.

_______________________
▋ INDICATOR SETTINGS:

(1) Naming the index.
(2) Entering a currency. To unite all securities in one currency.
(3) Table location on the chart.
(4) Table’s cells size.
(5) Table’s colors.
(6) Sorting table. By securities’ (Market Cap, Change%, Price, or Ticker Alphabetical) order.
(7) Plotting formation (Candle, Bar, or Line)
(8) To show/hide any indicator’s components.
(9) There are 34 fields where user can fill them with symbols.
Please let me know if you have any questions.
The “Index Generator” simplifies the process of building a custom market index, allowing investors to enter a list of preferred holdings from global securities. It aims to serve as an approach for tracking performance, conducting research, and analyzing specific aspects of the global market. The output will include an index value, a table of holdings, and chart plotting, providing a deeper understanding of historical movement.
_______________________
▋ OVERVIEW:
The image can be taken as an example of building a custom index. I created this index and named it “My Oil & Gas Index”. The index comprises several global energy companies. Essentially, the indicator weights each company by collecting the number of shares and then computes the market capitalization before sorting them as seen in the table.
_______________________
▋ OUTPUTS:
The output can be divided into 3 sections:
1. Index Title (Name & Value).
2. Index Holdings.
3. Index Chart.
1. Index Title, displays the index name at the top, and at the bottom, it shows the index value, along with the daily change in points and percentage.
2. Index Holdings, displays list the holding securities inside a table that contains the ticker, price, daily change %, market cap, and weight %. Additionally, a tooltip appears when the user passes the cursor over a ticker's cell, showing brief information about the company, such as the company's name, exchange market, country, sector, and industry.
3. Index Chart, display a plot of the historical movement of the index in the form of a bar, candle, or line chart.
_______________________
▋ INDICATOR SETTINGS:
(1) Naming the index.
(2) Entering a currency. To unite all securities in one currency.
(3) Table location on the chart.
(4) Table’s cells size.
(5) Table’s colors.
(6) Sorting table. By securities’ (Market Cap, Change%, Price, or Ticker Alphabetical) order.
(7) Plotting formation (Candle, Bar, or Line)
(8) To show/hide any indicator’s components.
(9) There are 34 fields where user can fill them with symbols.
Please let me know if you have any questions.
Release Notes
Fixed tooltip bug. Open-source script
In true TradingView spirit, the creator of this script has made it open-source, so that traders can review and verify its functionality. Kudos to the author! While you can use it for free, remember that republishing the code is subject to our House Rules.
For quick access on a chart, add this script to your favorites — learn more here.
Trusted Pine Programmer, For Coding Inquiries
► Website muqwishi.com/home/quotation/
► Telegram t.me/MUQWISHI
► Email service@muqwishi.com
⛾ Support My Work on “Buy Me a Coffee” buymeacoffee.com/muqwishi
► Website muqwishi.com/home/quotation/
► Telegram t.me/MUQWISHI
► Email service@muqwishi.com
⛾ Support My Work on “Buy Me a Coffee” buymeacoffee.com/muqwishi
Disclaimer
The information and publications are not meant to be, and do not constitute, financial, investment, trading, or other types of advice or recommendations supplied or endorsed by TradingView. Read more in the Terms of Use.
Open-source script
In true TradingView spirit, the creator of this script has made it open-source, so that traders can review and verify its functionality. Kudos to the author! While you can use it for free, remember that republishing the code is subject to our House Rules.
For quick access on a chart, add this script to your favorites — learn more here.
Trusted Pine Programmer, For Coding Inquiries
► Website muqwishi.com/home/quotation/
► Telegram t.me/MUQWISHI
► Email service@muqwishi.com
⛾ Support My Work on “Buy Me a Coffee” buymeacoffee.com/muqwishi
► Website muqwishi.com/home/quotation/
► Telegram t.me/MUQWISHI
► Email service@muqwishi.com
⛾ Support My Work on “Buy Me a Coffee” buymeacoffee.com/muqwishi
Disclaimer
The information and publications are not meant to be, and do not constitute, financial, investment, trading, or other types of advice or recommendations supplied or endorsed by TradingView. Read more in the Terms of Use.