OPEN-SOURCE SCRIPT
Updated FLEX KDJ IND
Hi Dears!
Here you have this ability to define different methods to aquire high and low bonds in KDJ indicator.
Thses Topologies are available in Popup menu and could be defined by user:
- "AVG" : Use average of cashed data in both High and low Bond
- "MEDIAN" : Use median of cashed data in both High and low Bond
- "MAX" : Use Max of cashed data in both High and low Bond
- "MIN" : Use Min of cashed data in both High and low Bond
- "WIDE" : Use Max of cashed data in High and Min of them for low Bond
- "NARROW" : Use Min of cashed data in High and Max of them for low Bond
- "FIX" : Use predefined constant values by user in 'Max BOND' and 'Min BOND'
- "GAUSS" Use statistical standard deviation method and 'Mult. Max BOND' and 'Mult. Min BOND' to calculate High and low Bond.
In "LEFT RANGE" and "RIGHT RANGE" you can define the range which be used to find pivot and extremum points in calculation of highest and lowest LONG-TERM KDJ Line.
'MEMORY' is the size of cash that you want to collect the extracted data from extreimum points for highest and lowest LONG-TERM-KDJ. If overflowing from this point the oldest value would be kicked from cash.
Other parts are same in KDJ Indicators.
Enjoy trading!
Shakib.
Release Notes
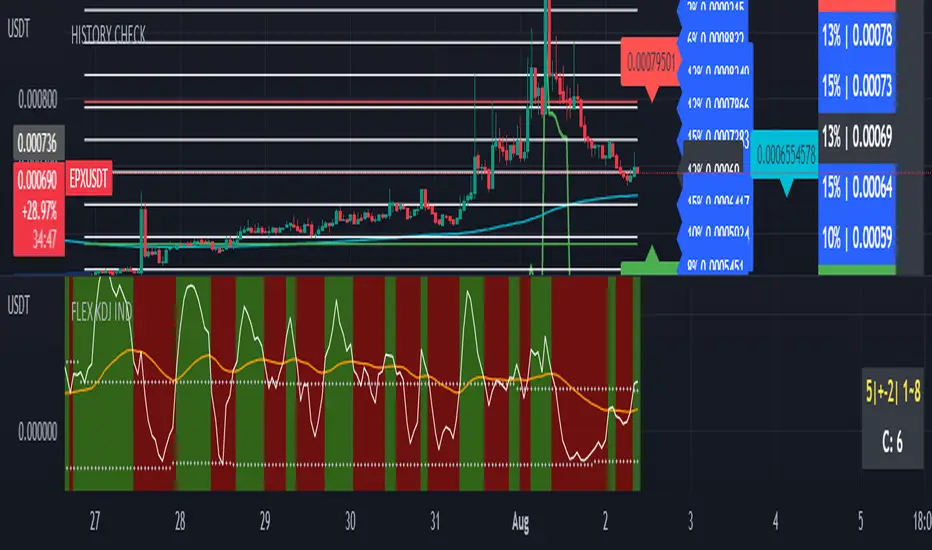
There were two variables that has to be reversed.Add to this now user has a number to guess till when red area would be continued.
Firts number in yellow is the Average, second one is the Std and thirs one is the range.
White value is the current (or the last) counter in red area.
ENJOY!
Release Notes
Two smoothing length are now separated to be similar to what we have in KDJ IND in binance.Release Notes
I just check it and found that the picture of indicator is not relevant to the indicator! The version is still same as before just pictured in published script is changed.happy trade
Release Notes
Hi Dears!in new Version you have two more options for your boundaries definitions:
- [LOWER BOND, UPPER BOND]
Open-source script
In true TradingView spirit, the creator of this script has made it open-source, so that traders can review and verify its functionality. Kudos to the author! While you can use it for free, remember that republishing the code is subject to our House Rules.
For quick access on a chart, add this script to your favorites — learn more here.
Disclaimer
The information and publications are not meant to be, and do not constitute, financial, investment, trading, or other types of advice or recommendations supplied or endorsed by TradingView. Read more in the Terms of Use.