OPEN-SOURCE SCRIPT
Updated Money Flow Divergence Indicator
Overview
The Money Flow Divergence Indicator is designed to help traders and investors identify key macroeconomic turning points by analyzing the relationship between U.S. M2 money supply growth and the S&P 500 Index (SPX). By comparing these two crucial economic indicators, the script highlights periods where market liquidity is outpacing or lagging behind stock market growth, offering potential buy and sell signals based on macroeconomic trends.
How It Works
1. Data Sources
2. Growth Rate Calculation
3. Visualization
How to Use It
✅ Bullish Signal: When green bars appear consistently, indicating that liquidity is outpacing stock market growth. This suggests a favorable environment for buying or holding positions.
❌ Bearish Signal: When red bars appear consistently, meaning stock market growth outpaces liquidity expansion, signaling potential overvaluation or a market correction.
Best Timeframes for Analysis
This indicator works best on monthly timeframes (M) since it is designed for long-term investors and macro traders who focus on broad economic cycles.
Who Should Use This Indicator?
📈 Long-term investors looking for macroeconomic trends.
📊 Swing traders who incorporate liquidity analysis in their strategies.
💰 Portfolio managers assessing market liquidity conditions.
🚀 Use this indicator to stay ahead of market trends and make informed investment decisions based on macroeconomic liquidity shifts! 🚀
The Money Flow Divergence Indicator is designed to help traders and investors identify key macroeconomic turning points by analyzing the relationship between U.S. M2 money supply growth and the S&P 500 Index (SPX). By comparing these two crucial economic indicators, the script highlights periods where market liquidity is outpacing or lagging behind stock market growth, offering potential buy and sell signals based on macroeconomic trends.
How It Works
1. Data Sources
- S&P 500 Index (SPX500USD): Tracks the stock market performance.
- U.S. M2 Money Supply (M2SL - Federal Reserve Economic Data): Represents available liquidity in the economy.
2. Growth Rate Calculation
- SPX Growth: Percentage change in the S&P 500 index over time.
- M2 Growth: Percentage change in M2 money supply over time.
- Growth Gap (Delta): The difference between M2 growth and SPX growth, showing whether liquidity is fueling or lagging behind market performance.
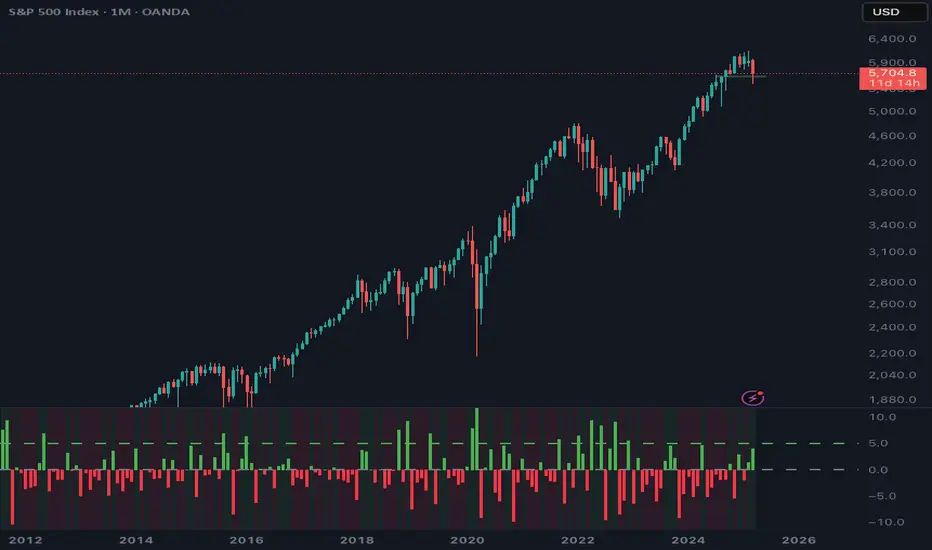
3. Visualization
- A histogram displays the growth gap over time:
- Green Bars: M2 growth exceeds SPX growth (potential bullish signal).
- Red Bars: SPX growth exceeds M2 growth (potential bearish signal).
- A zero line helps distinguish between positive and negative growth gaps.
How to Use It
✅ Bullish Signal: When green bars appear consistently, indicating that liquidity is outpacing stock market growth. This suggests a favorable environment for buying or holding positions.
❌ Bearish Signal: When red bars appear consistently, meaning stock market growth outpaces liquidity expansion, signaling potential overvaluation or a market correction.
Best Timeframes for Analysis
This indicator works best on monthly timeframes (M) since it is designed for long-term investors and macro traders who focus on broad economic cycles.
Who Should Use This Indicator?
📈 Long-term investors looking for macroeconomic trends.
📊 Swing traders who incorporate liquidity analysis in their strategies.
💰 Portfolio managers assessing market liquidity conditions.
🚀 Use this indicator to stay ahead of market trends and make informed investment decisions based on macroeconomic liquidity shifts! 🚀
Release Notes
OverviewThe Money Flow Divergence Indicator is designed to help traders and investors identify key macroeconomic turning points by analyzing the relationship between U.S.
M2 money supply growth and the S&P 500 Index (SPX). By comparing these two crucial economic indicators, the script highlights periods where market liquidity is outpacing or lagging behind stock market growth, offering potential buy and sell signals based on macroeconomic trends.
How It Works
1. Data Sources
S&P 500 Index (SPX500USD): Tracks the stock market performance.
U.S. M2 Money Supply (M2SL - Federal Reserve Economic Data): Represents available liquidity in the economy.
2. Growth Rate Calculation
- SPX Growth: Percentage change in the S&P 500 index over time.
- M2 Growth: Percentage change in M2 money supply over time.
- Growth Gap (Delta): The difference between M2 growth and SPX growth, showing whether liquidity is fueling or lagging behind market performance.
3. Visualization
A histogram displays the growth gap over time:
🟢 Green Bars: M2 growth exceeds SPX growth (potential bullish signal).
🔴 Red Bars: SPX growth exceeds M2 growth (potential bearish signal).
How to Use It
✅ Bullish Signal:
When green bars appear consistently, indicating that liquidity is outpacing stock market growth. This suggests a favorable environment for buying or holding positions.
❌ Bearish Signal:
When red bars appear consistently, meaning stock market growth outpaces liquidity expansion, signaling potential overvaluation or a market correction.
Best Timeframes for Analysis
This indicator works on Weekly (W) or Monthly (M) timeframes.
Works best on monthly (M) since it is designed for long-term investors and macro traders who focus on broad economic cycles.
Who Should Use This Indicator?
📈 Long-term investors looking for macroeconomic trends.
📊 Swing traders who incorporate liquidity analysis in their strategies.
💰 Portfolio managers assessing market liquidity conditions.
🚀 Use this indicator to stay ahead of market trends and make informed investment decisions based on macroeconomic liquidity shifts! 🚀
Release Notes
...Open-source script
In true TradingView spirit, the creator of this script has made it open-source, so that traders can review and verify its functionality. Kudos to the author! While you can use it for free, remember that republishing the code is subject to our House Rules.
For quick access on a chart, add this script to your favorites — learn more here.
Disclaimer
The information and publications are not meant to be, and do not constitute, financial, investment, trading, or other types of advice or recommendations supplied or endorsed by TradingView. Read more in the Terms of Use.
Open-source script
In true TradingView spirit, the creator of this script has made it open-source, so that traders can review and verify its functionality. Kudos to the author! While you can use it for free, remember that republishing the code is subject to our House Rules.
For quick access on a chart, add this script to your favorites — learn more here.
Disclaimer
The information and publications are not meant to be, and do not constitute, financial, investment, trading, or other types of advice or recommendations supplied or endorsed by TradingView. Read more in the Terms of Use.