PROTECTED SOURCE SCRIPT
The Edge Trend Indicator
Updated
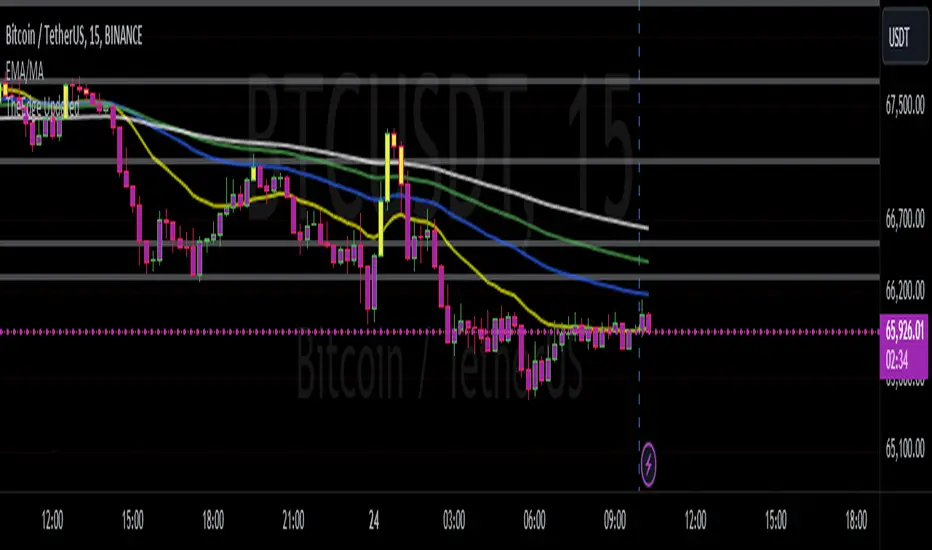
The edge trend indicator script uses exponential moving averages (EMA) cross overs (Death and golden crosses) of the 50 and 200 EMA and positive and negative slopes of the 50 EMA to decide the current trend. The candle sticks are color coded for ease of use and will change color depending on the rules. They will either change yellow when the 50 EMA has a positive slope or has crossed above the 200 EMA to go Long in your position or turn purple when the 50 EMA has a negative slope or crosses below the 200 EMA which indicates to sell and go short. It was designed to be used with the daily or 2 day timeframe in mind.
Release Notes
Update to my original script 24.7.2024The edge indicator is trend following indicator that uses fast and slow EMAS and relies on the slop of the fast EMA as well has golden and death crosses of the EMAS to decide direction, when the trend is bullish the candles will turn Yellow and when the the trend is bearish the candles will turn Purple, this indicators is best used on the daily and 2 day time framer
Disclaimer
The information and publications are not meant to be, and do not constitute, financial, investment, trading, or other types of advice or recommendations supplied or endorsed by TradingView. Read more in the Terms of Use.