PROTECTED SOURCE SCRIPT
Updated Ethereum: Value Days Destroyed (VDD) Multiple

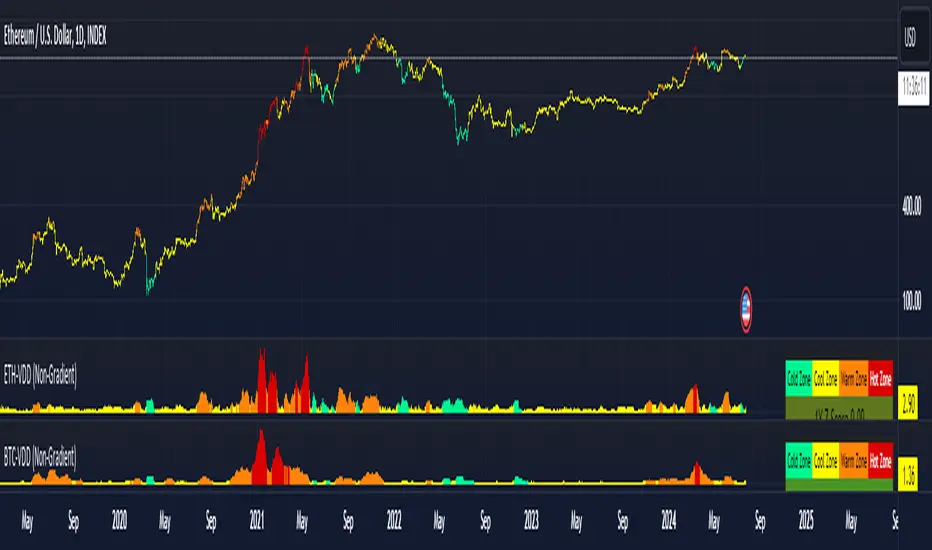
This indicator helps visualize Ethereum market conditions by categorizing them into four heat zones: Cold, Cool, Warm, and Hot. It uses data from Ethereum prices and trading volumes to determine these zones.
Key Concepts:
Heat Zones:
Data Sources:
Table: Displays a legend of the heat zones and the z score of 1 year.
Key Concepts:
Heat Zones:
- Cold Zone: Market is very cold.
- Cool Zone: Market is cool.
- Warm Zone: Market is warming up.
- Hot Zone: Market is very hot.
Data Sources:
- Bitcoin Prices: High and low prices.
- Market Capitalization: Realized market cap of Bitcoin.
- Trading Volume: Total volume of Bitcoin transferred.
Table: Displays a legend of the heat zones and the z score of 1 year.
Release Notes
.Protected script
This script is published as closed-source. However, you can use it freely and without any limitations – learn more here.
Disclaimer
The information and publications are not meant to be, and do not constitute, financial, investment, trading, or other types of advice or recommendations supplied or endorsed by TradingView. Read more in the Terms of Use.
Protected script
This script is published as closed-source. However, you can use it freely and without any limitations – learn more here.
Disclaimer
The information and publications are not meant to be, and do not constitute, financial, investment, trading, or other types of advice or recommendations supplied or endorsed by TradingView. Read more in the Terms of Use.