OPEN-SOURCE SCRIPT
Stochastic by BTBS
A little word before you are going to use it, this indicator is just a MODIFIED script.
The calculation part is NOT FROM ME, its still the original script by TradingView.
The Usage is still the same as you can take out of the info tab by TradingView.
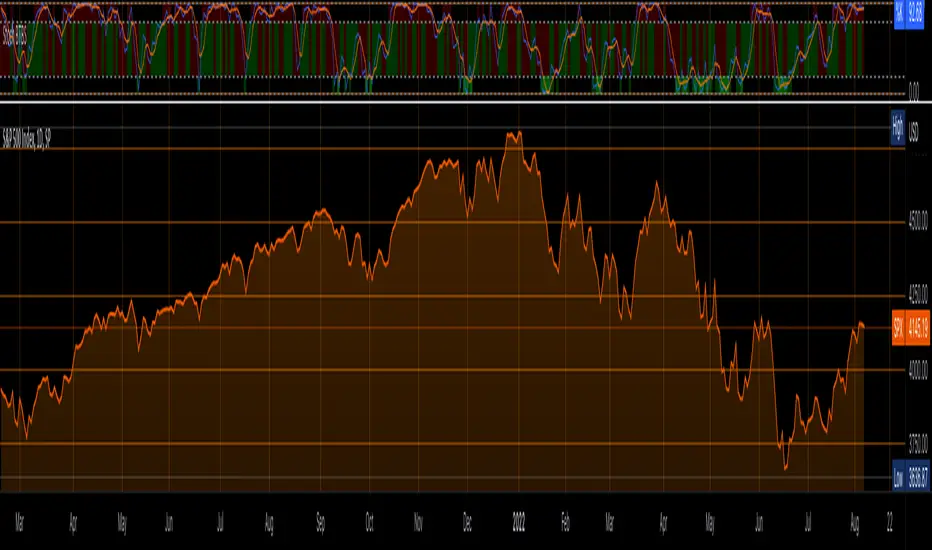
The only difference is that the Color Changes red when:
1. %K is over 80 (Upper Band-High Band)=(OVERBOUGHT)
2. %D lays over %K (%D>%K)
Changes green when:
1.%K is under 20 (Lower Band-Low Band)=(OVERSOLD)
%K lays over %D (%K>%D)
Tell me what I can add or do better :)
Tag me if you use this in a public Analysis :)
The calculation part is NOT FROM ME, its still the original script by TradingView.
The Usage is still the same as you can take out of the info tab by TradingView.
The only difference is that the Color Changes red when:
1. %K is over 80 (Upper Band-High Band)=(OVERBOUGHT)
2. %D lays over %K (%D>%K)
Changes green when:
1.%K is under 20 (Lower Band-Low Band)=(OVERSOLD)
%K lays over %D (%K>%D)
Tell me what I can add or do better :)
Tag me if you use this in a public Analysis :)
Open-source script
In true TradingView spirit, the creator of this script has made it open-source, so that traders can review and verify its functionality. Kudos to the author! While you can use it for free, remember that republishing the code is subject to our House Rules.
For quick access on a chart, add this script to your favorites — learn more here.
Disclaimer
The information and publications are not meant to be, and do not constitute, financial, investment, trading, or other types of advice or recommendations supplied or endorsed by TradingView. Read more in the Terms of Use.