OPEN-SOURCE SCRIPT
ICT Killzone Boxes
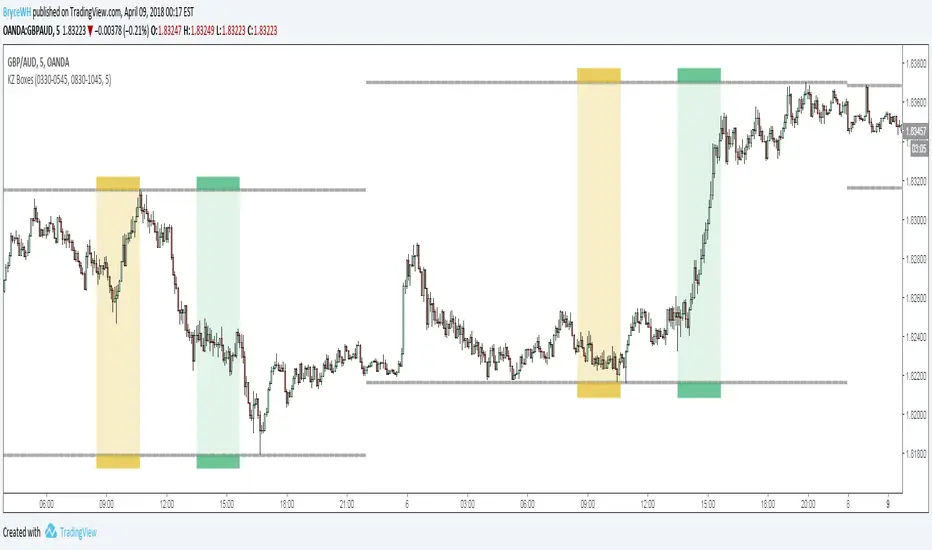
Plots London Open Killzone and New York Open Killzone as overlay boxes using current daily high / lows. Boxes verticle location will move as days range / high and low widens.
Middle fills can be turned on and off. Created this indicator because i didnt like highlighting the whole chart background as seen in other ICT Killzone indicators on tradingview and wanted something visually clearer.
If you want additional killzones such as london close / new york close, add the indicator to the chart twice.
Boxes height can be changed. Positive number puts the box outside current days high and low, negative number puts box inside current days high and low.
Adapted from Chris Moody's original indicator HLOC
Sorry for my ugly code. Presented as is - feel free to tweak / modify and change.
Open-source script
In true TradingView spirit, the creator of this script has made it open-source, so that traders can review and verify its functionality. Kudos to the author! While you can use it for free, remember that republishing the code is subject to our House Rules.
For quick access on a chart, add this script to your favorites — learn more here.
Disclaimer
The information and publications are not meant to be, and do not constitute, financial, investment, trading, or other types of advice or recommendations supplied or endorsed by TradingView. Read more in the Terms of Use.