PROTECTED SOURCE SCRIPT
Fully customisable indicator in one chart (EMA MACD RSI Stoch)
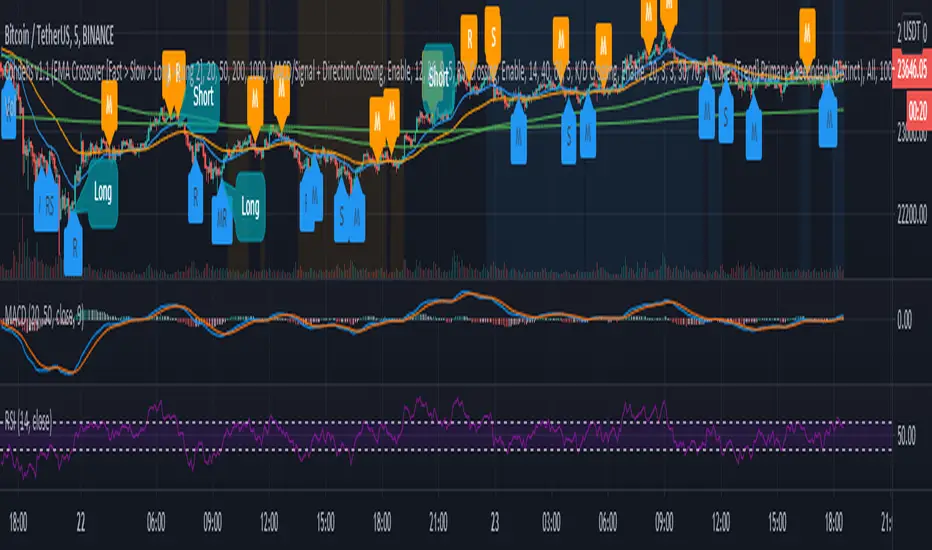
While facing problem having too many indicator charts on the same screen, this squashed the candle chart and produces flat lines. This script helps to put them all in 1 chart and label the indicators where it meet the long/short conditions. Backtest is available to check the multiple indicators for a Long / Short trade, eg. if the EMA is on a long trend, but RSI and MACD is at oversell this could put a long trade. This gives the trader a flexibility to customise their trade setup
EMA (Primary)
MACD (Secondary)
RSI (Secondary)
Stoch (Secondary)
Backtest
EMA (Primary)
- 4 period options (fast, slow, long, long2)
- Shows blue background when the trend is up
- Red when down
- The trend can be configured to (Fast > Slow), (Fast > Slow > Long), (Fast > Slow > Long > Long2)
MACD (Secondary)
- 3 options to indicate signal (MACD/Signal Crossover), (MACD/Signal + Direction Crossover), (MACD/Signal + Direction Crossing)
- Configurable MACD options
- Option to determine the length of MACD crossing to indicate the trend MACD is heading towards
- MACD/Signal Crossover when MACD crosses the Signal
- MACD/Signal + Direction Crossover sees if the histogram is up or down
- MACD/Signal + Direction Crossing checks the previous and current candle where current MACD crosses Signal but the previous MACD is below Signal
RSI (Secondary)
- 2 options (RSI Upper/Lower Crossover), (RSI Crossing)
- RSI options
- Option to determine the length of RSI crossing
- RSI Upper/Lower Crossover looks at the RSI vs the band
- RSI Crossing checks current candle entering band but previous candle is outside band
Stoch (Secondary)
- 3 options (K/D Crossover), (K/D + Upper/Lower Crossover), (K/D Crossing)
- Stoch options
- Stoch crossing length
- K/D Crossover when K crosses D
- K/D + Upper/Lower Crossover looks at the band
- K/D + Crossing is when K or D entering band but previous is outside band
Backtest
- Different backtest scenario, finetuning in progress..
Protected script
This script is published as closed-source. However, you can use it freely and without any limitations – learn more here.
Disclaimer
The information and publications are not meant to be, and do not constitute, financial, investment, trading, or other types of advice or recommendations supplied or endorsed by TradingView. Read more in the Terms of Use.