OPEN-SOURCE SCRIPT
Bollinger Bands Multi TF
Bollinger Bands Multi TF Indicator
Overview
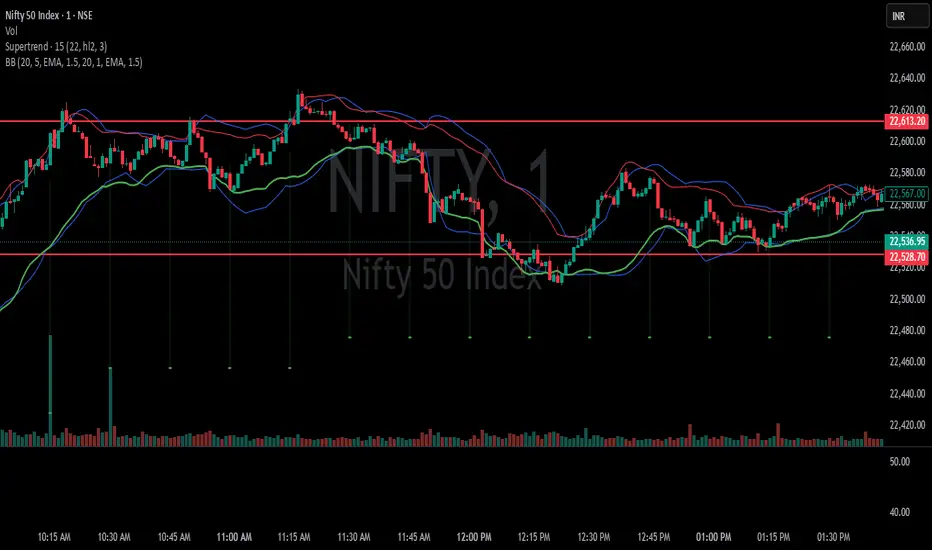
The Bollinger Bands Multi TF Indicator allows traders to overlay two sets of Bollinger Bands from different timeframes onto the same chart. This provides a broader market perspective by helping identify volatility and trend direction across multiple timeframes.
Features
✅ Dual Timeframe Support – Configure Bollinger Bands for two different timeframes (default: 15 min & 5 min).
✅ Customizable Moving Averages – Choose from SMA, EMA, SMMA (RMA), WMA, or VWMA as the basis line for each band.
✅ Dynamic Standard Deviation – Adjust the standard deviation multiplier for each timeframe.
✅ Visual Clarity – Different colors for each Bollinger Band set, with background filling for better visualization.
How to Use
🔹 Use the higher timeframe Bollinger Bands to identify overall trend and key resistance/support levels.
🔹 Use the lower timeframe Bollinger Bands for fine-tuned entry/exit signals within the broader trend.
🔹 A tightening of bands may indicate low volatility, signaling a potential breakout.
🔹 A widening of bands may suggest increased volatility and trend continuation.
Ideal For
📈 Intraday and swing traders looking for multi-timeframe confluence.
📊 Volatility-based traders who use Bollinger Bands for breakouts or reversals.
📍 Any trader wanting a deeper market context beyond a single timeframe.
Overview
The Bollinger Bands Multi TF Indicator allows traders to overlay two sets of Bollinger Bands from different timeframes onto the same chart. This provides a broader market perspective by helping identify volatility and trend direction across multiple timeframes.
Features
✅ Dual Timeframe Support – Configure Bollinger Bands for two different timeframes (default: 15 min & 5 min).
✅ Customizable Moving Averages – Choose from SMA, EMA, SMMA (RMA), WMA, or VWMA as the basis line for each band.
✅ Dynamic Standard Deviation – Adjust the standard deviation multiplier for each timeframe.
✅ Visual Clarity – Different colors for each Bollinger Band set, with background filling for better visualization.
How to Use
🔹 Use the higher timeframe Bollinger Bands to identify overall trend and key resistance/support levels.
🔹 Use the lower timeframe Bollinger Bands for fine-tuned entry/exit signals within the broader trend.
🔹 A tightening of bands may indicate low volatility, signaling a potential breakout.
🔹 A widening of bands may suggest increased volatility and trend continuation.
Ideal For
📈 Intraday and swing traders looking for multi-timeframe confluence.
📊 Volatility-based traders who use Bollinger Bands for breakouts or reversals.
📍 Any trader wanting a deeper market context beyond a single timeframe.
Open-source script
In true TradingView spirit, the creator of this script has made it open-source, so that traders can review and verify its functionality. Kudos to the author! While you can use it for free, remember that republishing the code is subject to our House Rules.
For quick access on a chart, add this script to your favorites — learn more here.
Disclaimer
The information and publications are not meant to be, and do not constitute, financial, investment, trading, or other types of advice or recommendations supplied or endorsed by TradingView. Read more in the Terms of Use.