OPEN-SOURCE SCRIPT
Relative Strength Index & Stochastic RSI
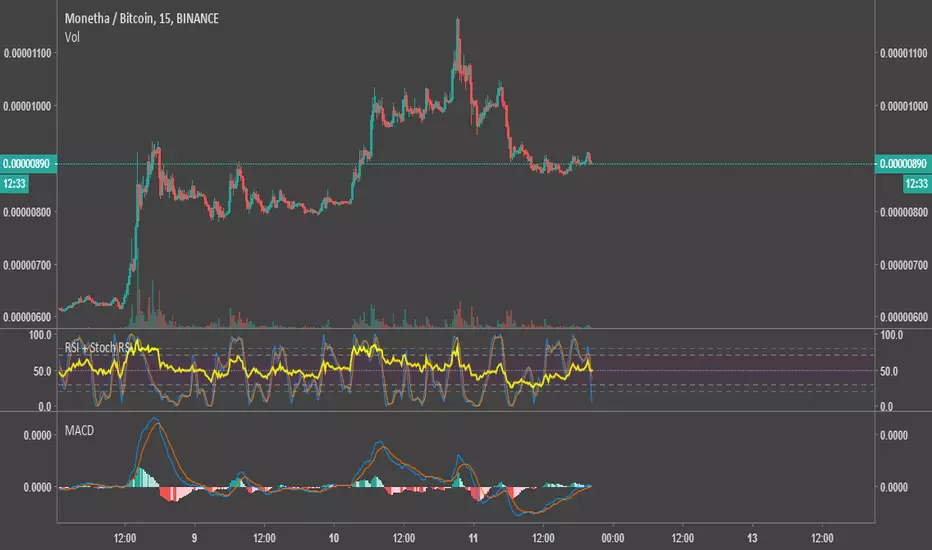
This script calculates both RSI (Relative Strength Index) and Stock (Stochastic) RSI Indicators, and plots them with a distinctive background on the same graph. The colors were chosen to be very easy on the eyes.
I published it as a way to give back to this community. Use your own judgement when trading, I am not responsible for any losses resulting from the use of my script.
Feel free to modify the script with no attribution.
I published it as a way to give back to this community. Use your own judgement when trading, I am not responsible for any losses resulting from the use of my script.
Feel free to modify the script with no attribution.
Open-source script
In true TradingView spirit, the creator of this script has made it open-source, so that traders can review and verify its functionality. Kudos to the author! While you can use it for free, remember that republishing the code is subject to our House Rules.
Disclaimer
The information and publications are not meant to be, and do not constitute, financial, investment, trading, or other types of advice or recommendations supplied or endorsed by TradingView. Read more in the Terms of Use.