OPEN-SOURCE SCRIPT
Moving Average ADX with Alerts
# Moving Average ADX (MA ADX) Indicator
## Overview
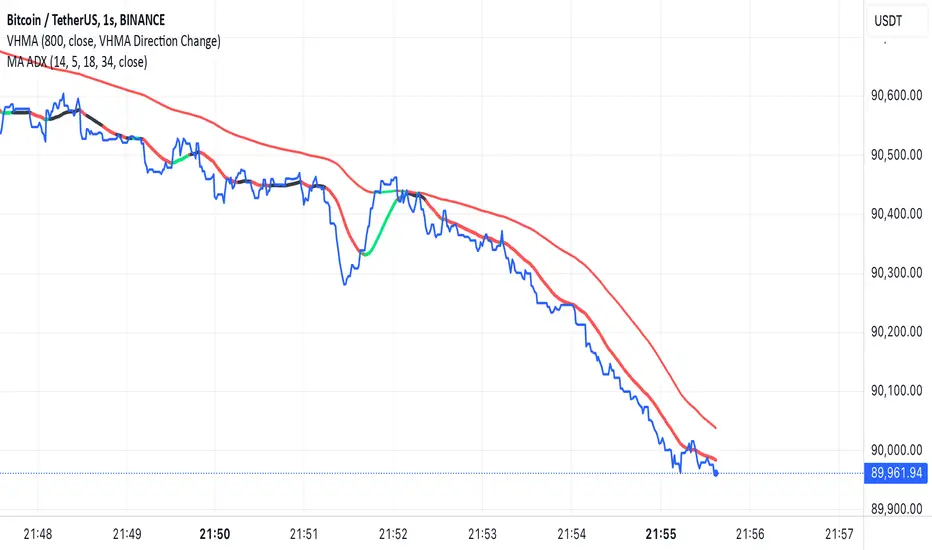
The Moving Average ADX combines a weighted moving average (WMA) with ADX (Average Directional Index) momentum to create a dynamic, trend-following indicator. The indicator's line changes color based on the ADX strength and directional movement, helping traders identify strong trends and potential reversals.
## Key Features
- Color-changing WMA line based on ADX strength and direction
- Built-in alerts for trend changes
- Customizable ADX and moving average parameters
- Overlay indicator that plots directly on the price chart
## Color Signals
- **Green Line**: Strong bullish trend (ADX > threshold with +DI > -DI)
- **Red Line**: Strong bearish trend (ADX > threshold with -DI > +DI)
- **Black Line**: Weak or no trend (ADX < threshold)
## Parameters
- **DI Length**: Period for calculating Directional Movement (default: 14)
- **ADX Smoothing**: Smoothing period for ADX calculation (default: 14)
- **ADX MA Active**: Threshold for ADX to consider a trend strong (default: 18)
- **Length**: Period for the Weighted Moving Average (default: 34)
- **Source**: Price source for calculations (default: close)
## Trading Applications
1. **Trend Identification**
- Green line suggests riding bullish trends
- Red line suggests riding bearish trends
- Black line suggests ranging or weak trend conditions
2. **Entry Signals**
- Color changes from black to green: Potential bullish entry
- Color changes from black to red: Potential bearish entry
3. **Exit Signals**
- Color changes from green to black or red: Consider exiting longs
- Color changes from red to black or green: Consider exiting shorts
## Alert Functions
The indicator includes two built-in alerts:
1. Bullish Signal: Triggers when the indicator turns bullish (green)
2. Bearish Signal: Triggers when the indicator turns bearish (red)
## Best Practices
- Use in conjunction with other technical analysis tools
- Consider the overall market context
- Wait for confirmation of color changes before taking action
- Use appropriate position sizing and risk management
## Overview
The Moving Average ADX combines a weighted moving average (WMA) with ADX (Average Directional Index) momentum to create a dynamic, trend-following indicator. The indicator's line changes color based on the ADX strength and directional movement, helping traders identify strong trends and potential reversals.
## Key Features
- Color-changing WMA line based on ADX strength and direction
- Built-in alerts for trend changes
- Customizable ADX and moving average parameters
- Overlay indicator that plots directly on the price chart
## Color Signals
- **Green Line**: Strong bullish trend (ADX > threshold with +DI > -DI)
- **Red Line**: Strong bearish trend (ADX > threshold with -DI > +DI)
- **Black Line**: Weak or no trend (ADX < threshold)
## Parameters
- **DI Length**: Period for calculating Directional Movement (default: 14)
- **ADX Smoothing**: Smoothing period for ADX calculation (default: 14)
- **ADX MA Active**: Threshold for ADX to consider a trend strong (default: 18)
- **Length**: Period for the Weighted Moving Average (default: 34)
- **Source**: Price source for calculations (default: close)
## Trading Applications
1. **Trend Identification**
- Green line suggests riding bullish trends
- Red line suggests riding bearish trends
- Black line suggests ranging or weak trend conditions
2. **Entry Signals**
- Color changes from black to green: Potential bullish entry
- Color changes from black to red: Potential bearish entry
3. **Exit Signals**
- Color changes from green to black or red: Consider exiting longs
- Color changes from red to black or green: Consider exiting shorts
## Alert Functions
The indicator includes two built-in alerts:
1. Bullish Signal: Triggers when the indicator turns bullish (green)
2. Bearish Signal: Triggers when the indicator turns bearish (red)
## Best Practices
- Use in conjunction with other technical analysis tools
- Consider the overall market context
- Wait for confirmation of color changes before taking action
- Use appropriate position sizing and risk management
Open-source script
In true TradingView spirit, the creator of this script has made it open-source, so that traders can review and verify its functionality. Kudos to the author! While you can use it for free, remember that republishing the code is subject to our House Rules.
For quick access on a chart, add this script to your favorites — learn more here.
Disclaimer
The information and publications are not meant to be, and do not constitute, financial, investment, trading, or other types of advice or recommendations supplied or endorsed by TradingView. Read more in the Terms of Use.