OPEN-SOURCE SCRIPT
Updated Exchange Net Highs-Lows
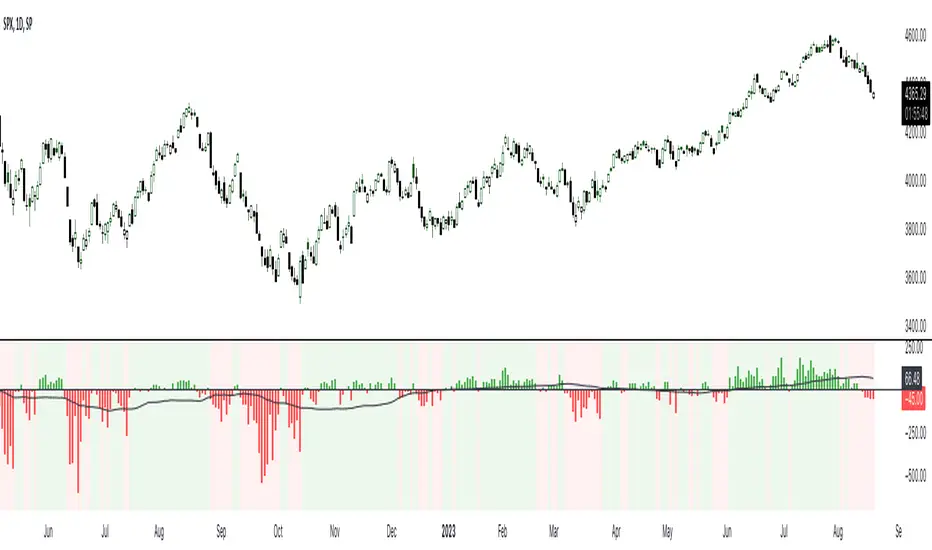
Displays the net new 52 week highs - 52 week lows for either the NYSE or Nasdaq. Select colors and moving average input within the settings.
Release Notes
Added shading for if the Net H-L is above or below the 50 SMA. A useful market signal that I learned from @StaresAtCandles. Release Notes
Updated data sources and cleaned up format of code.Open-source script
In true TradingView spirit, the creator of this script has made it open-source, so that traders can review and verify its functionality. Kudos to the author! While you can use it for free, remember that republishing the code is subject to our House Rules.
For quick access on a chart, add this script to your favorites — learn more here.
Disclaimer
The information and publications are not meant to be, and do not constitute, financial, investment, trading, or other types of advice or recommendations supplied or endorsed by TradingView. Read more in the Terms of Use.
Open-source script
In true TradingView spirit, the creator of this script has made it open-source, so that traders can review and verify its functionality. Kudos to the author! While you can use it for free, remember that republishing the code is subject to our House Rules.
For quick access on a chart, add this script to your favorites — learn more here.
Disclaimer
The information and publications are not meant to be, and do not constitute, financial, investment, trading, or other types of advice or recommendations supplied or endorsed by TradingView. Read more in the Terms of Use.