OPEN-SOURCE SCRIPT
HALO Oracle - CoffeeKiller
HALO Oracle - CoffeeKiller Indicator Guide
Hello traders! Today I'm going to walk you through how to use the HALO Oracle indicator, which is a powerful tool for identifying market trends and potential reversal points.
Basic Overview
The HALO Oracle is a trend-following indicator that combines Heiken Ashi candles with golden ratio calculations to help you identify market direction and key price levels.
Main Features
1. Time Settings
- You have two modes for time analysis:
- Normal Mode: The indicator analyzes each individual candle on your chart
- Custom Resolution Mode: You can use a different timeframe for calculations than what's shown on your chart
* For example, you could view a 5-minute chart but have the indicator calculate based on 1-hour data
* Available timeframes include Monthly (M), Weekly (W), Daily (D), 4 Hours (240), 1 Hour (60), etc.
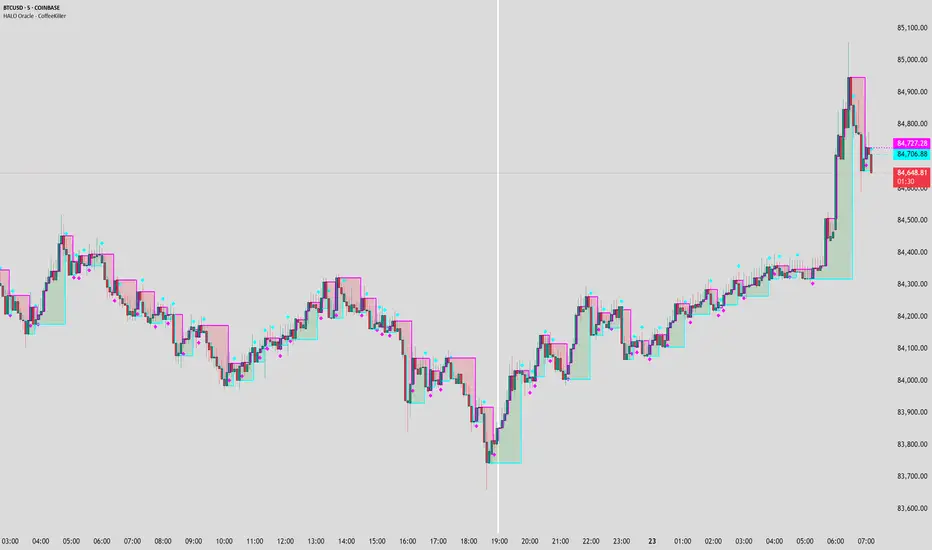
2. Visual Components
Bands and Fill
- Two main bands: green and red
- The space between these bands is filled with colors:
- Green fill indicates a bullish trend
- Red fill indicates a bearish trend
- You can adjust the thickness of the bands and the transparency of the fill colors
Marker Lines
- High Marker Line (magenta): Tracks the highest opening price during bullish trends
- Low Marker Line (cyan): Tracks the lowest opening price during bearish trends
- These lines create a "zone" that helps identify potential support and resistance levels
- Diamond markers appear when the trend resets
Background Fill
- Optional full-chart background coloring
- Green background for bullish trends
- Red background for bearish trends
How to Read the Indicator
1. **Trend Identification**
- Green fill/background indicates a bullish trend
- Red fill/background indicates a bearish trend
- Watch for color changes as they signal potential trend changes
2. **Support and Resistance Levels**
- The bands create dynamic support and resistance zones
- Price tends to respect these levels during strong trends
- Watch for price reactions when it touches either band
3. **Marker Lines**
- These act as historical support/resistance levels
- The space between marker lines creates a "zone" where price might find support or resistance
- Diamond shapes appear when these levels reset, indicating potential trend changes
Trading Tips
1. **Trend Trading**
- Trade in the direction of the background color
- Look for pullbacks to the support/resistance bands in the trend direction
- Use marker lines as potential entry/exit points
2. **Reversal Signals**
- Watch for diamond markers as they indicate trend resets
- Confirm reversals with price action and other indicators
- Pay attention to how price reacts around marker lines
3. **Timeframe Analysis**
- Use custom resolution for a broader market perspective
- Higher timeframes for overall trend
- Lower timeframes for entry/exit timing
Customization Options
1. **Display Settings**
- Toggle bands and fill visibility
- Adjust line thickness
- Customize colors for all components
2. **Background Options**
- Toggle full-chart background
- Adjust background transparency
3. **Marker Line Settings**
- Toggle visibility of marker lines
- Toggle reset diamonds
- Customize marker line colors
Best Practices
1. Start with the default settings to understand how the indicator behaves
2. Gradually customize colors and settings to match your trading style
3. Use multiple timeframes to confirm trends
4. Don't trade solely based on the indicator - combine it with price action and other tools
5. Pay special attention to areas where marker lines and bands converge
6. Watch for diamond markers as they often precede significant moves
Remember, this indicator works best when used as part of a complete trading strategy, not in isolation.
The information and signals provided by this indicator are intended solely for educational and informational purposes. They do not constitute financial, legal, or any other professional advice. Past performance is not indicative of future results. Trading and investing involve significant risk, and it is strongly recommended that you use this indicator in conjunction with other analysis tools and indicators. Always consult with a qualified financial advisor or professional before making any investment decisions. The creators and distributors of this indicator expressly disclaim any liability for any losses incurred through the use of the indicator or reliance on the information provided. Use at your own risk.
Hello traders! Today I'm going to walk you through how to use the HALO Oracle indicator, which is a powerful tool for identifying market trends and potential reversal points.
Basic Overview
The HALO Oracle is a trend-following indicator that combines Heiken Ashi candles with golden ratio calculations to help you identify market direction and key price levels.
Main Features
1. Time Settings
- You have two modes for time analysis:
- Normal Mode: The indicator analyzes each individual candle on your chart
- Custom Resolution Mode: You can use a different timeframe for calculations than what's shown on your chart
* For example, you could view a 5-minute chart but have the indicator calculate based on 1-hour data
* Available timeframes include Monthly (M), Weekly (W), Daily (D), 4 Hours (240), 1 Hour (60), etc.
2. Visual Components
Bands and Fill
- Two main bands: green and red
- The space between these bands is filled with colors:
- Green fill indicates a bullish trend
- Red fill indicates a bearish trend
- You can adjust the thickness of the bands and the transparency of the fill colors
Marker Lines
- High Marker Line (magenta): Tracks the highest opening price during bullish trends
- Low Marker Line (cyan): Tracks the lowest opening price during bearish trends
- These lines create a "zone" that helps identify potential support and resistance levels
- Diamond markers appear when the trend resets
Background Fill
- Optional full-chart background coloring
- Green background for bullish trends
- Red background for bearish trends
How to Read the Indicator
1. **Trend Identification**
- Green fill/background indicates a bullish trend
- Red fill/background indicates a bearish trend
- Watch for color changes as they signal potential trend changes
2. **Support and Resistance Levels**
- The bands create dynamic support and resistance zones
- Price tends to respect these levels during strong trends
- Watch for price reactions when it touches either band
3. **Marker Lines**
- These act as historical support/resistance levels
- The space between marker lines creates a "zone" where price might find support or resistance
- Diamond shapes appear when these levels reset, indicating potential trend changes
Trading Tips
1. **Trend Trading**
- Trade in the direction of the background color
- Look for pullbacks to the support/resistance bands in the trend direction
- Use marker lines as potential entry/exit points
2. **Reversal Signals**
- Watch for diamond markers as they indicate trend resets
- Confirm reversals with price action and other indicators
- Pay attention to how price reacts around marker lines
3. **Timeframe Analysis**
- Use custom resolution for a broader market perspective
- Higher timeframes for overall trend
- Lower timeframes for entry/exit timing
Customization Options
1. **Display Settings**
- Toggle bands and fill visibility
- Adjust line thickness
- Customize colors for all components
2. **Background Options**
- Toggle full-chart background
- Adjust background transparency
3. **Marker Line Settings**
- Toggle visibility of marker lines
- Toggle reset diamonds
- Customize marker line colors
Best Practices
1. Start with the default settings to understand how the indicator behaves
2. Gradually customize colors and settings to match your trading style
3. Use multiple timeframes to confirm trends
4. Don't trade solely based on the indicator - combine it with price action and other tools
5. Pay special attention to areas where marker lines and bands converge
6. Watch for diamond markers as they often precede significant moves
Remember, this indicator works best when used as part of a complete trading strategy, not in isolation.
The information and signals provided by this indicator are intended solely for educational and informational purposes. They do not constitute financial, legal, or any other professional advice. Past performance is not indicative of future results. Trading and investing involve significant risk, and it is strongly recommended that you use this indicator in conjunction with other analysis tools and indicators. Always consult with a qualified financial advisor or professional before making any investment decisions. The creators and distributors of this indicator expressly disclaim any liability for any losses incurred through the use of the indicator or reliance on the information provided. Use at your own risk.
Open-source script
In true TradingView spirit, the creator of this script has made it open-source, so that traders can review and verify its functionality. Kudos to the author! While you can use it for free, remember that republishing the code is subject to our House Rules.
For quick access on a chart, add this script to your favorites — learn more here.
Disclaimer
The information and publications are not meant to be, and do not constitute, financial, investment, trading, or other types of advice or recommendations supplied or endorsed by TradingView. Read more in the Terms of Use.