OPEN-SOURCE SCRIPT
Volume Delta Dashboard
How It Works:
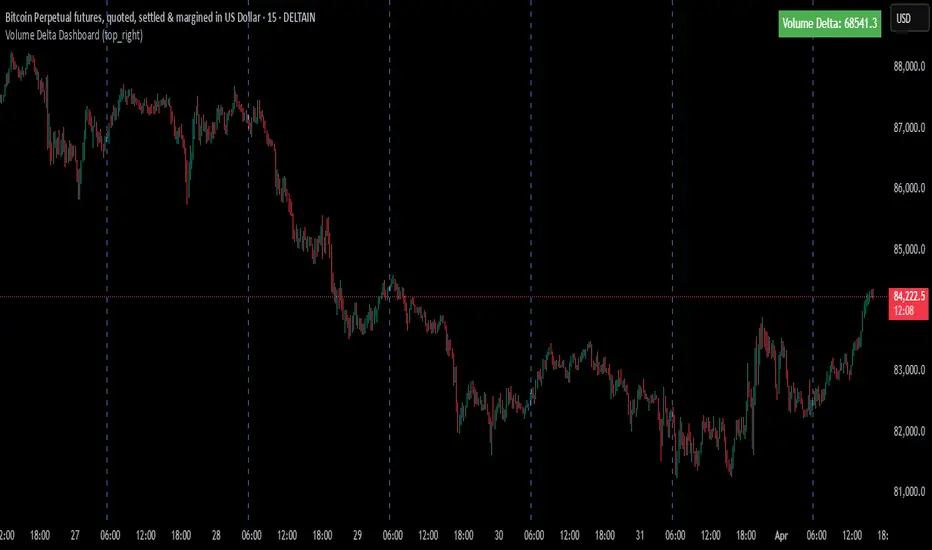
This script creates a Volume Delta Dashboard on TradingView, which helps traders visualize the balance between buying and selling volume (Volume Delta) directly on the chart. Here's a breakdown of the key components:
Volume Delta Calculation:
The script calculates the Volume Delta by comparing the volume of bars where the price closed higher (buying pressure) to those where the price closed lower (selling pressure).
Positive Volume Delta (green background) indicates more buying activity than selling, suggesting upward price movement. Negative Volume Delta (red background) indicates more selling than buying, signaling a potential downward move.
Smoothing with EMA:
To make the volume delta trend smoother and more consistent, an Exponential Moving Average (EMA) of the Volume Delta is used. This helps to reduce noise and highlight the prevailing buying or selling pressure over a 14-period.
Dynamic Position Selection:
The user can choose where the Volume Delta dashboard table will appear on the chart by selecting a position: top-left, top-right, bottom-left, or bottom-right. This makes the indicator adaptable to different chart setups.
Coloring:
The background of the table changes color based on the value of the Volume Delta. Green indicates a positive delta (more buyers), and Red indicates a negative delta (more sellers).
Use of This Strategy:
This Volume Delta Dashboard strategy is particularly useful for traders who want to:
Monitor Market Sentiment:
By observing the volume delta, traders can get a sense of whether there is more buying or selling pressure in the market. Positive volume delta can indicate a bullish sentiment, while negative delta can point to bearish sentiment.
Confirm Price Action:
The Volume Delta can be used alongside price action to confirm the strength of a price move. For example, if the price is moving up and the volume delta is positive, it suggests that the price increase is supported by buying pressure.
Identify Divergences:
Volume delta can help traders spot divergences between price and volume. For example, if the price is moving higher but the volume delta is negative, it may suggest a weakening trend and a potential reversal.
Optimize Entry/Exit Points:
By understanding the relationship between price movement and volume, traders can make more informed decisions about entering or exiting positions. For instance, a sudden increase in buying volume (positive delta) may indicate a good entry point for a long position.
Overall, the Volume Delta Dashboard can serve as a powerful tool for improving decision-making, by providing real-time insights into market dynamics and trading sentiment.
Open-source script
In true TradingView spirit, the creator of this script has made it open-source, so that traders can review and verify its functionality. Kudos to the author! While you can use it for free, remember that republishing the code is subject to our House Rules.
For quick access on a chart, add this script to your favorites — learn more here.
Disclaimer
The information and publications are not meant to be, and do not constitute, financial, investment, trading, or other types of advice or recommendations supplied or endorsed by TradingView. Read more in the Terms of Use.