OPEN-SOURCE SCRIPT
Candlestick Patterns [NAS Algo]

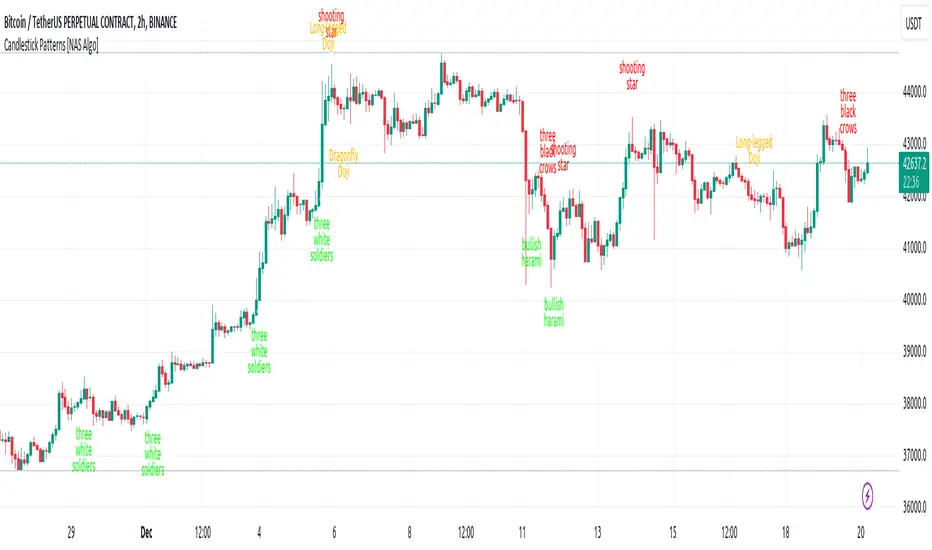
Candlestick Patterns [NAS Algo] plots most commonly used chart patterns to help and understand the market structure.
Bullish Reversal Patterns:
Hammer:
Appearance: Small body near the high, long lower shadow.
Interpretation: Indicates potential bullish reversal after a downtrend.
Inverted Hammer:
Appearance: Small body near the low, long upper shadow.
Interpretation: Signals potential bullish reversal, especially when the preceding trend is bearish.
Three White Soldiers:
Appearance: Three consecutive long bullish candles with higher closes.
Interpretation: Suggests a strong reversal of a downtrend.
Bullish Harami:
Appearance: Small candle (body) within the range of the previous large bearish candle.
Interpretation: Implies potential bullish reversal.
Bearish Reversal Patterns:
Hanging Man:
Appearance: Small body near the high, long lower shadow.
Interpretation: Suggests potential bearish reversal after an uptrend.
Shooting Star:
Appearance: Small body near the low, long upper shadow.
Interpretation: Indicates potential bearish reversal, especially after an uptrend.
Three Black Crows:
Appearance: Three consecutive long bearish candles with lower closes.
Interpretation: Signals a strong reversal of an uptrend.
Bearish Harami:
Appearance: Small candle (body) within the range of the previous large bullish candle.
Interpretation: Implies potential bearish reversal.
Dark Cloud Cover:
Appearance: Bearish reversal pattern where a bullish candle is followed by a bearish candle that opens above the high of the previous candle and closes below its midpoint.
Continuation Patterns:
Rising Three Methods:
Appearance: Consists of a long bullish candle followed by three small bearish candles and another bullish candle.
Interpretation: Indicates the continuation of an uptrend.
Falling Three Methods:
Appearance: Consists of a long bearish candle followed by three small bullish candles and another bearish candle.
Interpretation: Suggests the continuation of a downtrend.
Gravestone Doji:
Appearance: Doji candle with a long upper shadow, little or no lower shadow, and an opening/closing price near the low.
Interpretation: Signals potential reversal, particularly in an uptrend.
Long-Legged Doji:
Appearance: Doji with long upper and lower shadows and a small real body.
Interpretation: Indicates indecision in the market and potential reversal.
Dragonfly Doji:
Appearance: Doji with a long lower shadow and little or no upper shadow.
Interpretation: Suggests potential reversal, especially in a downtrend.
Open-source script
In true TradingView spirit, the creator of this script has made it open-source, so that traders can review and verify its functionality. Kudos to the author! While you can use it for free, remember that republishing the code is subject to our House Rules.
For quick access on a chart, add this script to your favorites — learn more here.
Disclaimer
The information and publications are not meant to be, and do not constitute, financial, investment, trading, or other types of advice or recommendations supplied or endorsed by TradingView. Read more in the Terms of Use.