OPEN-SOURCE SCRIPT
Updated IPDA operating range by makuchaku

Determining operating range is critical for trading.
You *need* to sell in premium & buy in discount.
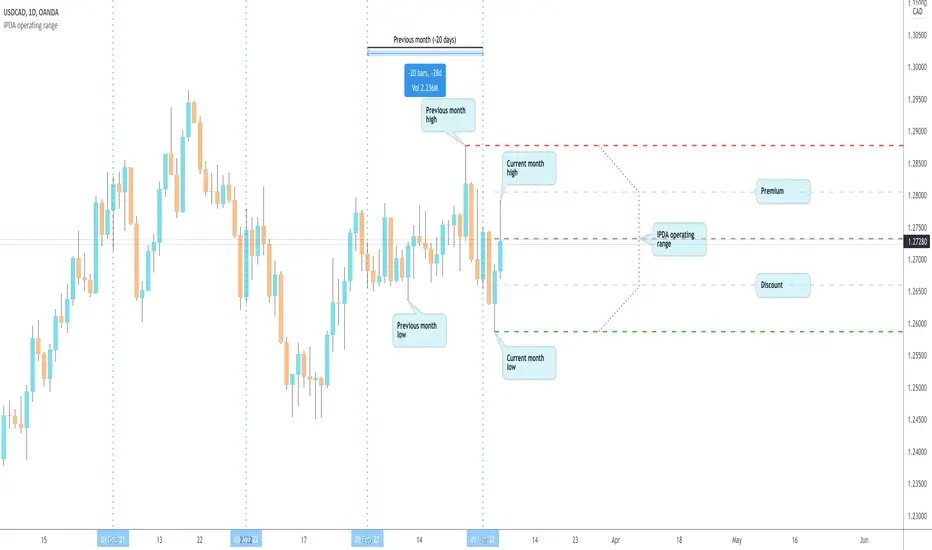
This script determines an operating range by stepping back on an HTF timeframe to calculate that HTF candle's range. If the current candle in HTF breaks out, the range expands accordingly.
The timeframe mapping I've used is
The HTF mapping is my own personal preference. If you prefer, you can easily copy the indicator and create your own mapping.
Once the HTF range is known, the indicator also plots 0%, 25%, 50% and 100% levels.
You *need* to sell in premium & buy in discount.
This script determines an operating range by stepping back on an HTF timeframe to calculate that HTF candle's range. If the current candle in HTF breaks out, the range expands accordingly.
The timeframe mapping I've used is
- Intraday & <= 2H : use Daily as HTF range
- Intraday & > 2H : use Weekly as HTF range
- Daily : use Monthly as HTF range
- Weekly : use 6 Months as HTF range
The HTF mapping is my own personal preference. If you prefer, you can easily copy the indicator and create your own mapping.
Once the HTF range is known, the indicator also plots 0%, 25%, 50% and 100% levels.
Release Notes
Updated details on chartRelease Notes
CleanupRelease Notes
When replaying candlesticks, old lines from the IPDA range are now deletedOpen-source script
In true TradingView spirit, the creator of this script has made it open-source, so that traders can review and verify its functionality. Kudos to the author! While you can use it for free, remember that republishing the code is subject to our House Rules.
Disclaimer
The information and publications are not meant to be, and do not constitute, financial, investment, trading, or other types of advice or recommendations supplied or endorsed by TradingView. Read more in the Terms of Use.
Open-source script
In true TradingView spirit, the creator of this script has made it open-source, so that traders can review and verify its functionality. Kudos to the author! While you can use it for free, remember that republishing the code is subject to our House Rules.
Disclaimer
The information and publications are not meant to be, and do not constitute, financial, investment, trading, or other types of advice or recommendations supplied or endorsed by TradingView. Read more in the Terms of Use.