PROTECTED SOURCE SCRIPT
Universally Applicable Valuation Indicator
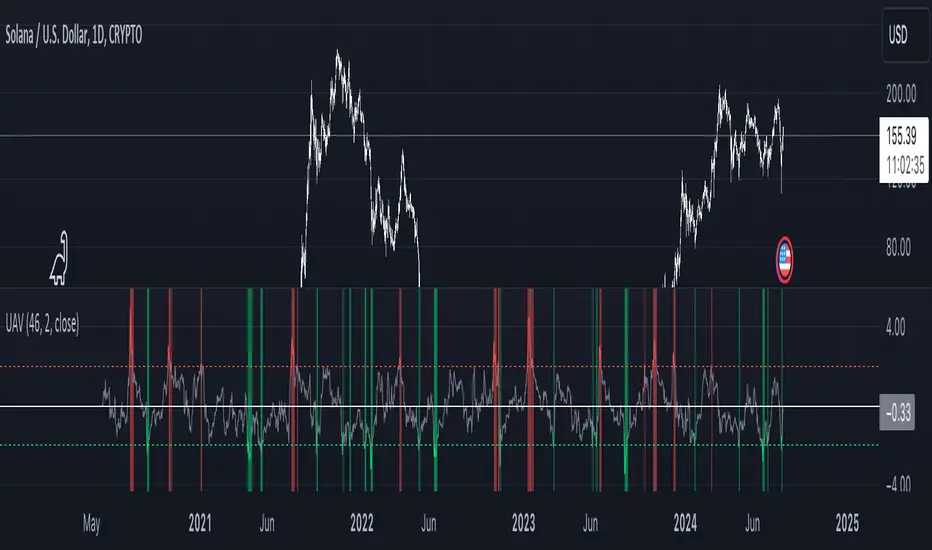
The UAV indicator utilizes a z-score analysis of the Relative Strength Index (RSI) to offer insights into current market conditions.
By comparing the current z-score to its historical distribution, the indicator generates signals that highlight potential overbought or oversold areas.
It features clear visual cues, with color changes occurring as the score crosses plotted standard deviation lines, making it easier to identify potential entry and exit points across all assets and timeframes.
Protected script
This script is published as closed-source. However, you can use it freely and without any limitations – learn more here.
Disclaimer
The information and publications are not meant to be, and do not constitute, financial, investment, trading, or other types of advice or recommendations supplied or endorsed by TradingView. Read more in the Terms of Use.