OPEN-SOURCE SCRIPT
Updated Valuation Rainbow
Valuation Rainbow
© danny_peanuts
Stock value based on Book Value, Earnings, Dividends and Money Multiplier
SV = (BVPS + EPS + DPS) * MM
BVPS = Book Value Per Share
EPS = Earnings Per Share
DPS = Dividends Per Share
MM = Money Multiplier - Integer Number from 1,2,3, ... ,7
There are multiple ways of valuing the stock. Book value is traditionally used as the basic valuation since it's calculate the total asset value minus the liabilities of any company. There are valuation based on multiplication of book value, there are valuation based on multiplication of earnings, and valuation based on multiplication of dividends. Here I'm proposing valuation based on all of these combined. So this indicator is measuring stock value based on multiplication of book value plus earning plus dividend per share. Since the money supply could have an multiplication effect so does the stock value could have a multiplication effect. Also notes that some blue chips stock tends to value higher than startup stock due to money is not equally distributed. So for simplicity I will use simple integer number to represent this multiplication effect as rainbow color plots, thus it can be applied to any stock at any given countries. The higher the stock price on valuation bands the most expensive it is and the lower the price on valuation bands the cheaper it is.
Release Notes
Adding Color GradientRelease Notes
Adding Gradient ColorRelease Notes
Update Transparent GradientRelease Notes
Update ChartRelease Notes
Update Gradient ColorRelease Notes
Add Fractional ValuationRelease Notes
Add Valuation Multiplier x2, x6, x8Add Valuation Divisor x0.2, x0.6, x0.8
Release Notes
Update Color GradientRelease Notes
Increase Gradient Multiplier and DivisorRelease Notes
Update Rainbow ColorRelease Notes
Update Line TransparencyRelease Notes
Fix Incorrect LabelRelease Notes
Add the Cashflow component to the equation. So it become the stock valuation based on Book Value, Earnings, Dividends, Cashflow and Money MultiplierSV = (BVPS + EPS + DPS + CFPS) * MM
BVPS = Book Value Per Share (Asset - Liabilities)
EPS = Earnings Per Share
DPS = Dividends Per Share
CFPS = Free Cash Flow Per Share
MM = Money Multiplier
Release Notes
Renaming to accommodate other Scripts:- Stock Value Rainbow: script to estimate stock value based on book value, earning, dividend, cashflow
- Index Value Rainbow: script to estimate index value based on fed balance sheet or base money supply
- Gold Value Rainbow: script to estimate gold value based on global base money supply
Release Notes
Updating the code to be more sensitive toward EPS changes by squaring it (and keeping the sign)Release Notes
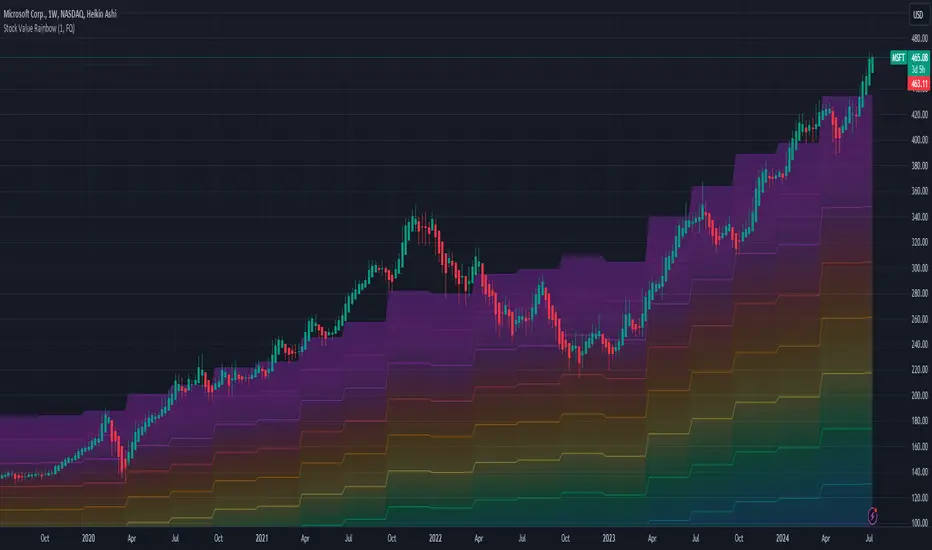
Stock Valuation based on Book Value, Dividends, Cashflow, Earnings and Estimates and Money MultiplierThere are many ways to measure stock valuations: some methods are using book value, some are using dividends, some are using cashflow, some are using earnings and some using estimates data. Most of these valuation methods are based on multiplier effect which measure how many times the stock price could expand from their valuation base. This indicator attempts to unify all these measurements using just simple addition of all measurements such as: book value per share, dividend per share, cashflow per share, earning per share, and estimates of earning per share and then using multiplier effect to create beautiful rainbow to see how far the stock has growing up above or below their valuation base. The higher the stock price on rainbow spectrum means it is more expensive and the lower in the rainbow spectrum means it is cheaper. Here is the basic formula explanation:
SV = (BVPS + DPS + CFPS + EPS + EST) * MM
BVPS = Book Value Per Share (Asset - Liability)
DPS = Dividends Per Share
CFPS = Free Cash Flow Per Share
EPS = Earnings Per Share
EST = Estimates of EPS
MM = Money Multiplier (1x, 2x, ... ,10x)
- The gray line represents the stock value SV
- The rainbow above the gray line represents the multiplication factors from 1x, 2x, ..., 10x
- The rainbow below the gray line represents the division factors from 0.8x, 0.6x, ..., 0.2x
Check other script to value stock and index:
- Stock Value Rainbow: script to value stock based on book value, dividend, cash flow, earning and estimates.
- Index Value Rainbow: script to value index based on fed balance sheet and base money supply
- Gold Value Rainbow: script to value gold based on global money supply
- Stock Value US: script to check US stock value
- Stock Value EU: script to check EU stock value
- Stock Value JP: script to check JP stock value
- Stock Value CN: script to check CN stock value
Open-source script
In true TradingView spirit, the creator of this script has made it open-source, so that traders can review and verify its functionality. Kudos to the author! While you can use it for free, remember that republishing the code is subject to our House Rules.
Disclaimer
The information and publications are not meant to be, and do not constitute, financial, investment, trading, or other types of advice or recommendations supplied or endorsed by TradingView. Read more in the Terms of Use.