OPEN-SOURCE SCRIPT
Moving Averages 50 & 200
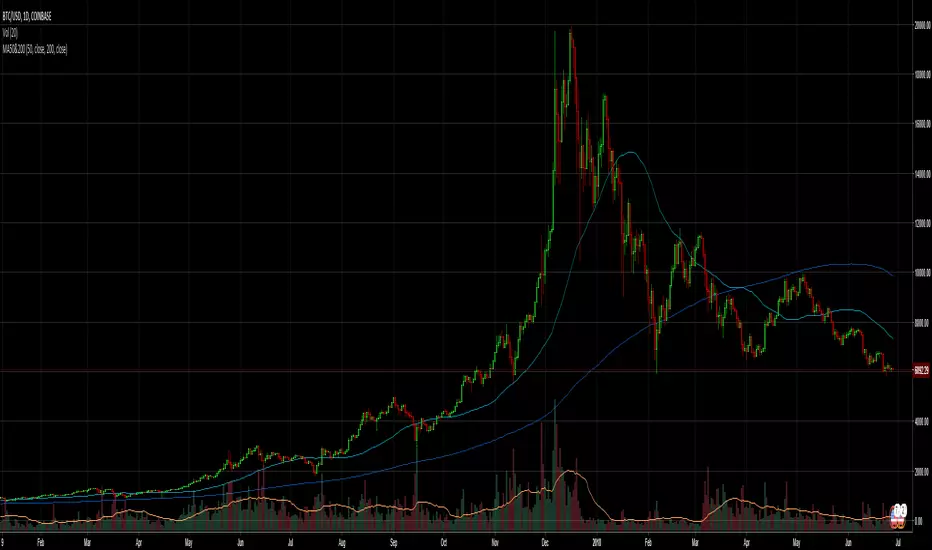
Moving Average Indicator for trading 50MA and 200MA crossovers (golden cross and death cross).
A golden cross is considered a bullish sign; it occurs when the 50-day moving average rises above 200-day moving average. A death cross is considered a bearish sign; it occurs when the 50-day moving average drops below 200-day moving average.
A golden cross is considered a bullish sign; it occurs when the 50-day moving average rises above 200-day moving average. A death cross is considered a bearish sign; it occurs when the 50-day moving average drops below 200-day moving average.
Open-source script
In true TradingView spirit, the creator of this script has made it open-source, so that traders can review and verify its functionality. Kudos to the author! While you can use it for free, remember that republishing the code is subject to our House Rules.
For quick access on a chart, add this script to your favorites — learn more here.
Disclaimer
The information and publications are not meant to be, and do not constitute, financial, investment, trading, or other types of advice or recommendations supplied or endorsed by TradingView. Read more in the Terms of Use.