OPEN-SOURCE SCRIPT
Updated Fair Value Calculator V 1.0
Fair Value Calculator V 1.0
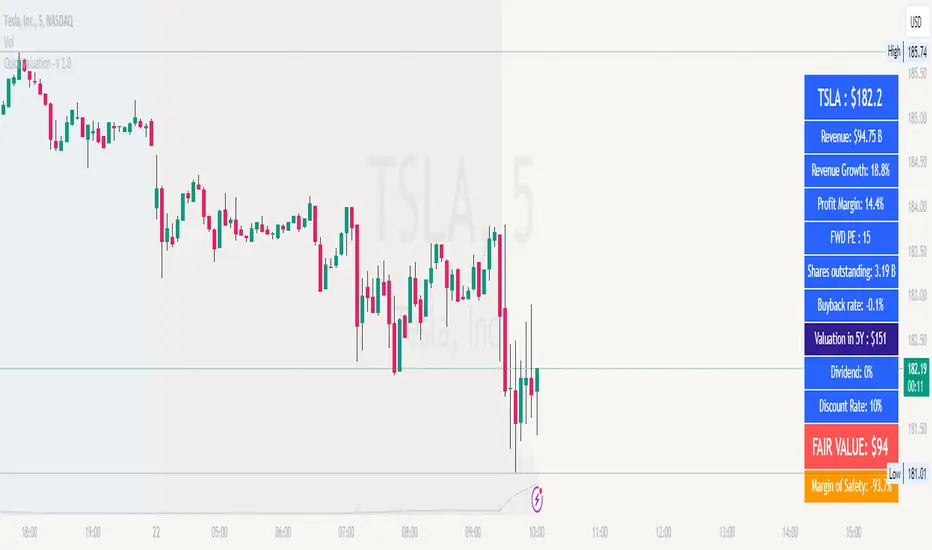
This indicator calculates the fair value of a stock based on the revenue growth rate and net profit margin of a company, providing a quick estimate of its intrinsic worth. The calculation takes into account:
Using these inputs, the indicator estimates the fair value of the stock, providing a valuable tool for investors and traders to make informed decisions.
Note: all values can be adjusted by the user by entering the desired value and selecting the item in the setup menu.
How it works
Benefits
Note
This indicator is for informational purposes only and should not be considered as investment advice. Always do your own research and consider multiple perspectives before making investment decisions.
This indicator calculates the fair value of a stock based on the revenue growth rate and net profit margin of a company, providing a quick estimate of its intrinsic worth. The calculation takes into account:
- Current Revenue: The company's current revenue
- 5-Year Growth Rate: Expected revenue annual growth rate (CAGR) over the next 5 years
- Average PE Ratio: The average Price-to-Earnings ratio for the next 5 years
- Average Profit Margin: The average profit margin for the next 5 years
- Share Outstanding: The total number of shares outstanding
- Yearly Share Buyback Rate: The percentage of shares bought back by the company each year
- Discount Rate: The rate used to calculate the present value of the fair value
Using these inputs, the indicator estimates the fair value of the stock, providing a valuable tool for investors and traders to make informed decisions.
Note: all values can be adjusted by the user by entering the desired value and selecting the item in the setup menu.
How it works
- The indicator calculates the future revenue based on the current revenue and the expected revenue annual growth rate (CAGR).
- It then estimates the future earnings using the average profit margin.
- The future price is calculated using the exit value of the PE ratio.
- The present value of the fair value is calculated using the discount rate.
- The indicator adjusts the fair value based on the yearly share buyback rate.
Benefits
- Provides a quick but valuable estimate of a stock's fair value based on the revenue growth and the expected profit.
- Helps investors and traders identify undervalued or overvalued stocks.
- Allows users to adjust inputs to suit their own assumptions and scenarios.
Note
This indicator is for informational purposes only and should not be considered as investment advice. Always do your own research and consider multiple perspectives before making investment decisions.
Release Notes
- Corrected the negative valuation issue.Open-source script
In true TradingView spirit, the creator of this script has made it open-source, so that traders can review and verify its functionality. Kudos to the author! While you can use it for free, remember that republishing the code is subject to our House Rules.
For quick access on a chart, add this script to your favorites — learn more here.
Disclaimer
The information and publications are not meant to be, and do not constitute, financial, investment, trading, or other types of advice or recommendations supplied or endorsed by TradingView. Read more in the Terms of Use.
Open-source script
In true TradingView spirit, the creator of this script has made it open-source, so that traders can review and verify its functionality. Kudos to the author! While you can use it for free, remember that republishing the code is subject to our House Rules.
For quick access on a chart, add this script to your favorites — learn more here.
Disclaimer
The information and publications are not meant to be, and do not constitute, financial, investment, trading, or other types of advice or recommendations supplied or endorsed by TradingView. Read more in the Terms of Use.