OPEN-SOURCE SCRIPT
Dukhan: 24 Hours rolling volume
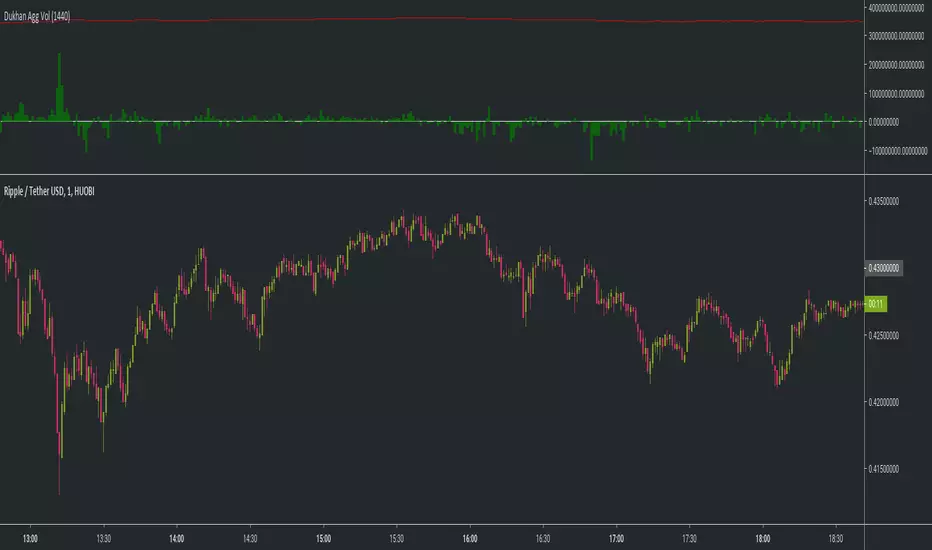
Shows rolling volume for 24 hours as exchanges does
default settings is for 1m candles
Inputs:
p = Period : is the number of candle to aggregate to the back, i.e for 1m candle there is 1440 candle in one day
for 5m candles as example: 24h * 60 / 5 = 288
so for 5m you have to change input p to be 288
Plots:
Red line is total volume
white line is per candle volume change from the previous one
Open-source script
In true TradingView spirit, the creator of this script has made it open-source, so that traders can review and verify its functionality. Kudos to the author! While you can use it for free, remember that republishing the code is subject to our House Rules.
For quick access on a chart, add this script to your favorites — learn more here.
Disclaimer
The information and publications are not meant to be, and do not constitute, financial, investment, trading, or other types of advice or recommendations supplied or endorsed by TradingView. Read more in the Terms of Use.