OPEN-SOURCE SCRIPT
Updated convolution
Description:
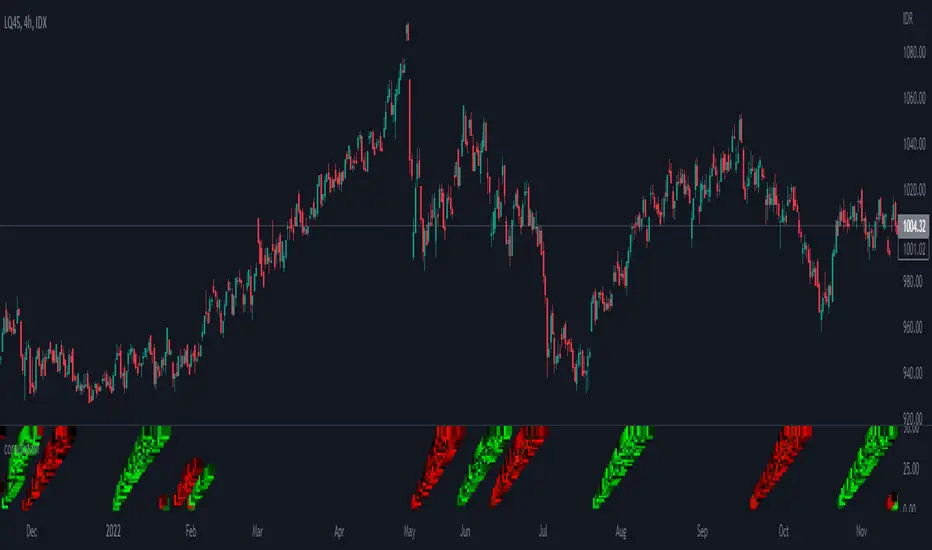
Convolution indicators aim to identify a major reversal in the price direction so that one can trade the market primarily in the direction of the ensuing trend, as described in the Cycle Analytics for Traders, by John F. Ehlers pg. 165. The notion is based on the concept of the two price segments are perfectly correlated (cross-correlated) that have been folded at the horizontal point, since high correlation exists only at the market turning point, e.g. price decreases linearly until the bottom is reached and then increases linearly after the bottom occurs and vice versa. The vertical scale is the lookback period, while the value is converted to colors.
Features:
- High-pass filter and Smoothing function on the input data
- Major reversals are identified by plumes pointing backward to the time of the price reversal
- Bullish reversal identified by the green color of the indicator,
- while Bearish reversal identified by a red color dominated the indicator
Release Notes
minor change, to displayed chartRelease Notes
.Release Notes
options to apply high-pass filterOpen-source script
In true TradingView spirit, the creator of this script has made it open-source, so that traders can review and verify its functionality. Kudos to the author! While you can use it for free, remember that republishing the code is subject to our House Rules.
For quick access on a chart, add this script to your favorites — learn more here.
Disclaimer
The information and publications are not meant to be, and do not constitute, financial, investment, trading, or other types of advice or recommendations supplied or endorsed by TradingView. Read more in the Terms of Use.
Open-source script
In true TradingView spirit, the creator of this script has made it open-source, so that traders can review and verify its functionality. Kudos to the author! While you can use it for free, remember that republishing the code is subject to our House Rules.
For quick access on a chart, add this script to your favorites — learn more here.
Disclaimer
The information and publications are not meant to be, and do not constitute, financial, investment, trading, or other types of advice or recommendations supplied or endorsed by TradingView. Read more in the Terms of Use.