OPEN-SOURCE SCRIPT
Bitcoin Bottom Detector: W Timeframe
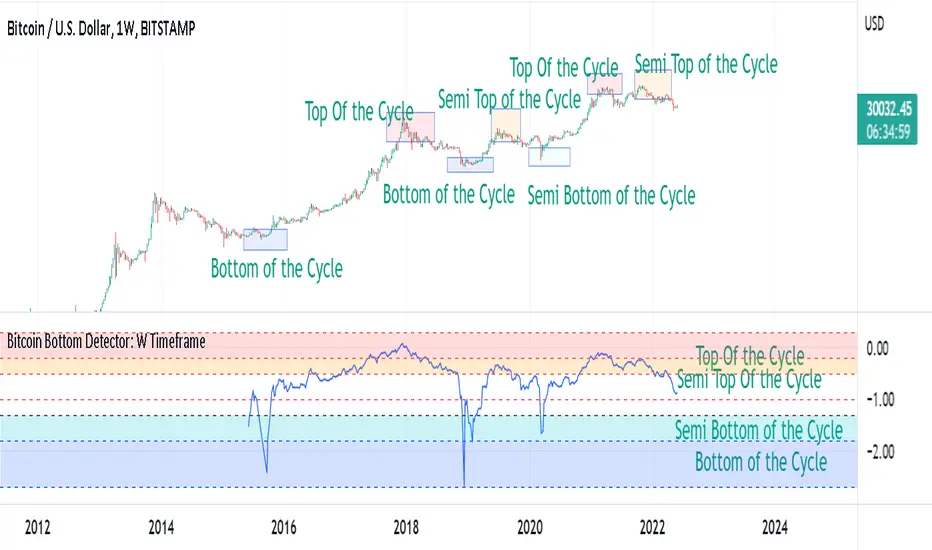
Use this indicator in the weekly time frame:
One of the most widely used indicators for identifying the Bitcoin market bottom is the 200-week moving average. This indicator works based on the ratio of price to the value of the 200-week moving average. When the indicator enters the lower blue part (overflow area), it indicates the bitcoin is in the bottom of the market.
One of the most widely used indicators for identifying the Bitcoin market bottom is the 200-week moving average. This indicator works based on the ratio of price to the value of the 200-week moving average. When the indicator enters the lower blue part (overflow area), it indicates the bitcoin is in the bottom of the market.
Open-source script
In true TradingView spirit, the creator of this script has made it open-source, so that traders can review and verify its functionality. Kudos to the author! While you can use it for free, remember that republishing the code is subject to our House Rules.
For quick access on a chart, add this script to your favorites — learn more here.
Disclaimer
The information and publications are not meant to be, and do not constitute, financial, investment, trading, or other types of advice or recommendations supplied or endorsed by TradingView. Read more in the Terms of Use.