M.Right Awesome RSI+ (cc)
Tonight I figured I'd release a special indicator that I've had in the works for years and finally was able to piece it together using pine. It's an extremely accurate take on the RSI. I plan to continue to refine the indicator and add more features, but as it is this is still one you can make a lot of money with.
(((((Please note: all circles and arrows in the chart above are drawn for illustration. Below is a chart showing regular session)))))
This indicator will act similarly to a regular RSI (Relative Strength Indicator) in that there are Oversold and Overbought levels, but also volatility bands around it to allow for more accurate signals whilst moving the Oversold (OS) and Overbought (OB) levels further apart (less false OB/OS signals). As shown in the chart above, it's able to detect some pretty big moves with both speed and accuracy.
Most of you are familiar with and use an RSI indicator so I will keep this description as brief as possible: The Relative Strength Index (RSI), developed by the legendary J. Welles Wilder, is a momentum oscillator that measures the speed and change of price movements; it oscillates between 0 - 100, with levels set as Overbought and Oversold. These levels are where a trader make look for a reversal, however they must keep in mind in an uptrend or bull market, the RSI tends to remain in the 40 - 90 range; 40 - 50 zone often will act as support. More advanced traders will also look for divergences between the price and the oscillator (i.e. price trending upward while oscillator trending downward). As far as oscillators go, the RSI is one of the most frequently used, by both advanced and beginner traders alike.
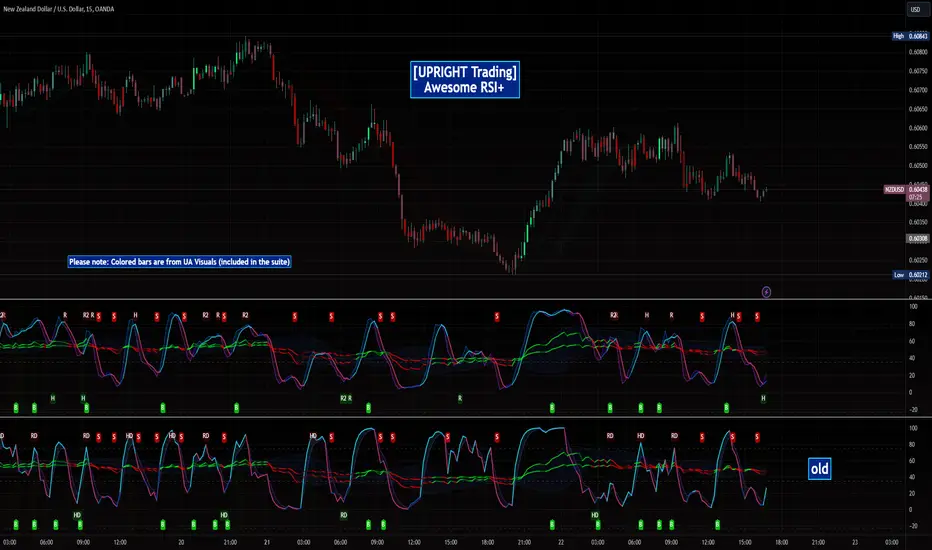
Works great on multiple timeframes. It may not catch every rally, but it will catch most --even on smaller timeframes (i.e. 5 minutes in image below).
As with all of my scripts I like to make them customizable:
You can change the up and down colors on the RSI ribbons and the color and style (dotted shown) of Overbought / Oversold lines. In future versions, I will add more color customizations and additions.
Can toggle 1 or both of the 2 highlight signals off to make it a little more plain.
Lot's of ways to make it look the way you'd like it to.
--The alerts include both the super accurate Bullish and Bearish signals shown with the background highlights. They are pre-filled so it will automatically display the price and time that the alert went off for you.
If I missed anything or you have a question, please let me know!
Cheers,
Mike
Please note: I have made this indicator invite only, send me a DM if you're interested in trying it out.
Cheers,
Mike
- Added a few requested alerts (when changes color & ob/os).
- Improved the calculations and filters.
- Added new highlight.
- Numerous aesthetic adjustments.
Features:
- UPRIGHT's Ultra Smooth RSI for Ultra Fast confirmation.
- Stochastic RSI added for additional dimension.
- Stochastic RSI Divergences (Regular and Hidden w/Lines)
- Ultra RSI Regular Divergences (additional confirmation and early trend change detection).
- Extremely accurate background highlight buy & sell signals to be used with the above mentioned.
- Double RSI Ribbon provides both OB/OS detection and trend guidance.
- Fully customizable.
A closer look at 2.0:
Chart should look like this.
- Small Improvements.
- Even smaller bug fix.
- Now more signals than ever!
- Super accurate even with the signal increase.
- Adjust it to fit your style, lots of different options to customize.
- Always improving.
Enjoy!
Sincerely,
Mike L.
- Added Buy/Sell Signals.
- Strategy Accuracy improvements - less unimportant signals
- Complete UI overhaul. Now it's easier to use.
- Added back additional prefilled B/S Alerts.
- Some minor optimizations.
- Added ability to move the position of Divergence signals for cleaner trading.
- Easily toggle all or individual Signals on/off.
--Fixed MTF bug
--Moved B signals closer to 0 line.
- Repaint 100% off. Added Option to turn on.
- Optimizations.
- Adjustable trend length.
- Some code clean-up.
- Ultra Smooth RSI off by default.
- Some color adjustments.
Now it's much easier to see the RSI Ribbon and it's color change - trend.
--Bug fixes.
--Tweaked a few settings.
-----Some of the signals will come a little earlier without adding much if any more.
--Slightly different defaults than previous version, for a cleaner start.
--Improved Settings UI.
--Insanely Fast Divergence Detection.
--R & R2 are Regular Divs and H are Hidden Divs.
--Code cleaning.
--Some algo enhancements/optimization.
--Much better color scheme and Stoch.
Invite-only script
Only users authorized by the author have access to this script, and this usually requires payment. You can add the script to your favorites, but you will only be able to use it after requesting permission and obtaining it from its author — learn more here. For more details, follow the author's instructions below or contact UPRIGHTTrading directly.
TradingView does NOT recommend paying for or using a script unless you fully trust its author and understand how it works. You may also find free, open-source alternatives in our community scripts.
Author's instructions
Warning: please read our guide for invite-only scripts before requesting access.
old site: uprighttrader.com
Scripts: tradingview.com/u/UPRIGHTTrading/
Like & follow for great ideas & indicators!
Disclaimer
Invite-only script
Only users authorized by the author have access to this script, and this usually requires payment. You can add the script to your favorites, but you will only be able to use it after requesting permission and obtaining it from its author — learn more here. For more details, follow the author's instructions below or contact UPRIGHTTrading directly.
TradingView does NOT recommend paying for or using a script unless you fully trust its author and understand how it works. You may also find free, open-source alternatives in our community scripts.
Author's instructions
Warning: please read our guide for invite-only scripts before requesting access.
old site: uprighttrader.com
Scripts: tradingview.com/u/UPRIGHTTrading/
Like & follow for great ideas & indicators!