OPEN-SOURCE SCRIPT
Updated Enhanced High-Low Difference Indicator
Enhanced High-Low Difference Indicator
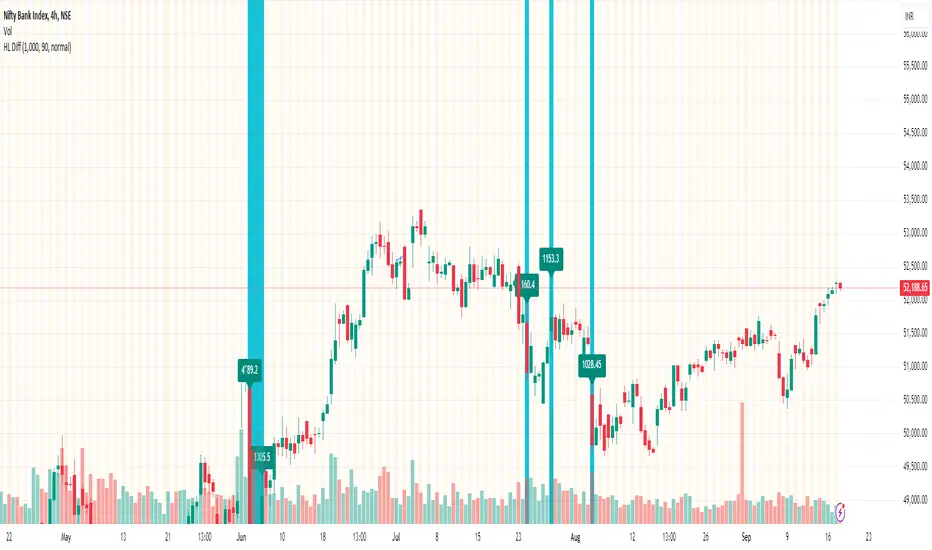
The "Enhanced High-Low Difference Indicator" is a powerful tool that highlights market volatility by tracking the difference between the high and low prices of a bar. Key features include:
Customizable Threshold: Set your own threshold for the high-low difference to filter out minor fluctuations.
Visual Highlights: Bars that exceed the threshold are highlighted with customizable color and opacity settings for easy identification.
Optional Labels: Display the exact high-low difference on the bars when the threshold is exceeded, with fully customizable label color and size.
High-Low Difference Line: Optionally plot a line that tracks the high-low difference of each bar for visual reference.
Alerts: Receive real-time alerts when the high-low difference exceeds your specified threshold.
Threshold Reference Line: Plot the threshold value as a horizontal reference line on the chart.
This indicator is ideal for traders looking to identify volatility spikes and make informed trading decisions based on price action.
Release Notes
Enhanced High-Low Difference IndicatorThe "Enhanced High-Low Difference Indicator" is a powerful tool that highlights market volatility by tracking the difference between the high and low prices of a bar. Key features include:
Customizable Threshold: Set your own threshold for the high-low difference to filter out minor fluctuations.
Visual Highlights: Bars that exceed the threshold are highlighted with customizable color and opacity settings for easy identification.
Optional Labels: Display the exact high-low difference on the bars when the threshold is exceeded, with fully customizable label color and size.
High-Low Difference Line: Optionally plot a line that tracks the high-low difference of each bar for visual reference.
Alerts: Receive real-time alerts when the high-low difference exceeds your specified threshold.
Threshold Reference Line: Plot the threshold value as a horizontal reference line on the chart.
This indicator is ideal for traders looking to identify volatility spikes and make informed trading decisions based on price action.
Open-source script
In true TradingView spirit, the creator of this script has made it open-source, so that traders can review and verify its functionality. Kudos to the author! While you can use it for free, remember that republishing the code is subject to our House Rules.
For quick access on a chart, add this script to your favorites — learn more here.
Disclaimer
The information and publications are not meant to be, and do not constitute, financial, investment, trading, or other types of advice or recommendations supplied or endorsed by TradingView. Read more in the Terms of Use.