OPEN-SOURCE SCRIPT
Indicator : Financial Table
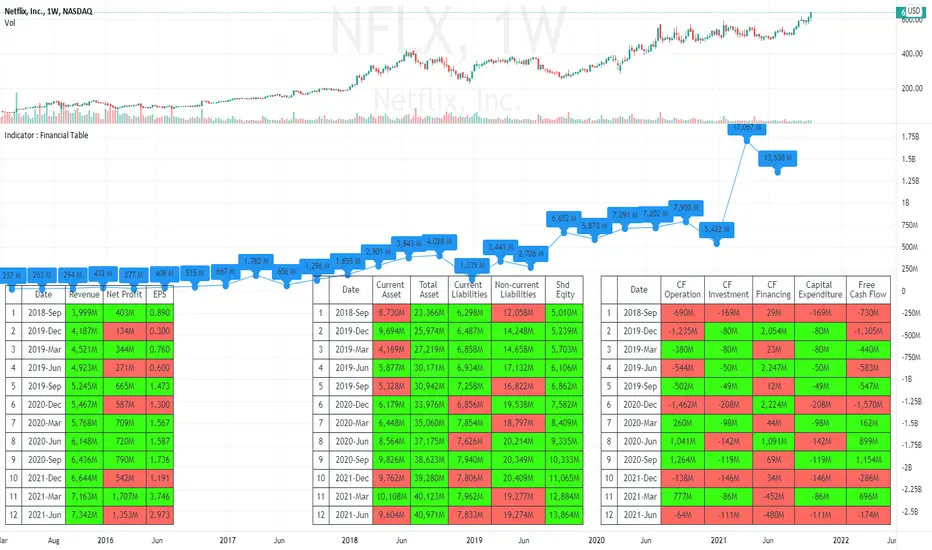
■ What is Financial Table?
Financial table is the table shows the finanacial data over period of time (Quartery : FQ, Annually : FY).
These incluse 3 tables,
1) Income Statement (Revenue, Net Profit (or Net Income) and EPS) .
2) Balance Sheet (Current Asset, Total Asset, Liabilites and Share Holder's Equity).
3) Cash Flow ( Cash Flow from Operating Activities, Investment, Financing and Free Cash Flow)
This data will allow us to get understanding of the status of a company financial status over time.
■ How to make it?
1) Get Financial Data
2) Decare array
3) Store the array if conditions are met.
4) Generate table
■ How to use?
1) You can select the report period : FQ (Quarterly) or FY (Annually).
2) You can also select the data to plot (Revenue, Net Profit and EPS).
3) Select how many quarter or year you want to get (It is available from 2014 only).
4) Customize text size and position of the table as you wish.
I'm new and appriciate your suggestion.
Open-source script
In true TradingView spirit, the creator of this script has made it open-source, so that traders can review and verify its functionality. Kudos to the author! While you can use it for free, remember that republishing the code is subject to our House Rules.
For quick access on a chart, add this script to your favorites — learn more here.
Disclaimer
The information and publications are not meant to be, and do not constitute, financial, investment, trading, or other types of advice or recommendations supplied or endorsed by TradingView. Read more in the Terms of Use.