OPEN-SOURCE SCRIPT
HILO Interpolation | QuantEdgeB
🚀 Introducing HILO Interpolation by QuantEdgeB
🛠️ Overview
HILO Interpolation is a dynamic price-action based signal engine crafted to adapt across trending and ranging conditions. By leveraging percentile-based price band interpolation, it identifies high-confidence breakout and breakdown zones. This indicator is designed to serve both as a momentum trigger in trend phases and as a price-reactive entry system during range-bound consolidation.
By intelligently switching between percentile thresholds and interpolated logic, HILO minimizes noise and whipsaws commonly seen in traditional crossover systems.
✨ Key Features
🔹 Percentile Interpolation Engine
Tracks price breakouts using percentile thresholds, making it adaptable to volatility and asset-specific structure.
🔹 Price-Based Signal Confirmation
Signals are only triggered when price meaningfully crosses through key percentile thresholds (based on historical high/low logic).
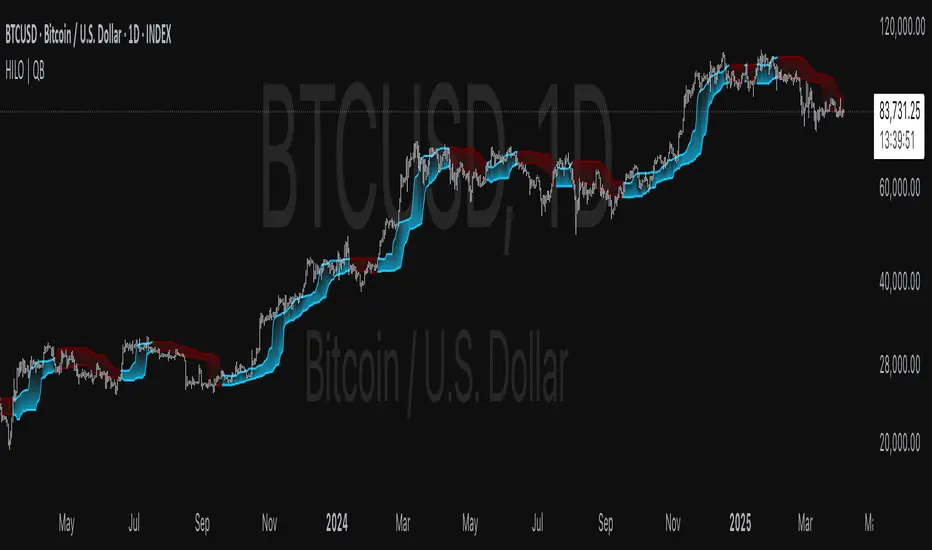
🔹 Visual Trend Encoding
Color-coded candles, dynamic interpolation bands, and optional long/cash labels give clear visual cues for trend and trade direction.
🔹 Dynamic Threshold Switching
Interpolated threshold flips based on where price sits relative to percentile bands—providing adaptive long/short logic.
📊 How It Works
1️⃣ Percentile Zone Definition
HILO defines two key percentiles from the historical high and low:
• Upper Threshold: 75th Percentile of Highs
• Lower Threshold: 50th Percentile of Lows
These are calculated using linear interpolation to ensure smoother transitions across lookback periods.
2️⃣ Adaptive Signal Line
Instead of using static crossovers, HILO dynamically flips its signal based on whether price exceeds the upper threshold or falls below the lower one.
📌 If price > upper → Signal = Short threshold
📌 If price < lower → Signal = Long threshold
📌 If price remains between thresholds → no flip (trend continuation)
3️⃣ Signal Logic
✅ Long Signal → Price exceeds upper bound while lower bound acts as ceiling
❌ Short Signal → Price breaks below lower percentile while upper bound flips
This simple yet powerful mechanism creates early entries while maintaining high signal confidence.
👁 Visual & Custom Features
• 🎨 Multiple Color Modes: Strategy, Solar, Warm, Cool, Classic, Magic
• 🔄 Dynamic Candle & Band Coloring
• 🏷️ Signal Labels: Optional “𝓛𝓸𝓷𝓰” and “𝓢𝓱𝓸𝓻𝓽” tags when trend flips
• 💬 Alerts Ready: Long/Short crossover conditions can trigger alerts instantly
👥 Who Should Use HILO?
✅ Breakout Traders – Catch early trend starts using percentile filters
✅ Swing Traders – Identify directional bias shifts in advance
✅ Range Strategists – Use band confluence zones to play reversions
✅ Quant & Rule-Based Traders – Incorporate percentile logic into broader systems
⚙️ Customization & Default Settings
Percentile Length:(Default 35) Lookback for calculating percentile thresholds
Lookback Period:(Default 4) Lag factor for interpolation responsiveness
Upper % Threshold: (Default 75) Defines breakout zone from historical highs
Lower % Threshold: (Default 50) Defines retest/accumulation zone from historical lows
📌 How to Use HILO in Trading
1️⃣ Trend-Following Strategy
✔ Enter long when price flips above the adaptive support line
✔ Exit or go short when price breaks below the interpolated resistance
✔ Continue position as long as trend color persists
2️⃣ Range-Reversion Strategy
✔ Buy when price tests the lower threshold and no short signal is triggered
✔ Sell or reduce when price hits the upper range boundary
🧠 Why It Works
HILO operates on the principle that historical price structure creates natural probabilistic thresholds. By interpolating between these using percentile logic, the system maintains adaptability to changing market conditions—without the lag of moving averages or the noise of fixed bands.
🔹 Conclusion
HILO Interpolation is a minimalist yet powerful signal engine built for adaptive breakout and reversion detection. Its percentile-based logic offers a novel way to identify structure shifts, giving traders an edge in both trend and range markets.
🔹 Key Takeaways:
1️⃣ Breakout Entry Logic – Uses percentile interpolation instead of static bands
2️⃣ Color-Driven Clarity – Visual clarity via gradient zone overlays
3️⃣ Trend Integrity – Avoids overfitting and responds only to significant price movements
📌 Disclaimer: Past performance is not indicative of future results. No trading strategy can guarantee success in financial markets.
📌 Strategic Advice: Always backtest, optimize, and align parameters with your trading objectives and risk tolerance before live trading.
🛠️ Overview
HILO Interpolation is a dynamic price-action based signal engine crafted to adapt across trending and ranging conditions. By leveraging percentile-based price band interpolation, it identifies high-confidence breakout and breakdown zones. This indicator is designed to serve both as a momentum trigger in trend phases and as a price-reactive entry system during range-bound consolidation.
By intelligently switching between percentile thresholds and interpolated logic, HILO minimizes noise and whipsaws commonly seen in traditional crossover systems.
✨ Key Features
🔹 Percentile Interpolation Engine
Tracks price breakouts using percentile thresholds, making it adaptable to volatility and asset-specific structure.
🔹 Price-Based Signal Confirmation
Signals are only triggered when price meaningfully crosses through key percentile thresholds (based on historical high/low logic).
🔹 Visual Trend Encoding
Color-coded candles, dynamic interpolation bands, and optional long/cash labels give clear visual cues for trend and trade direction.
🔹 Dynamic Threshold Switching
Interpolated threshold flips based on where price sits relative to percentile bands—providing adaptive long/short logic.
📊 How It Works
1️⃣ Percentile Zone Definition
HILO defines two key percentiles from the historical high and low:
• Upper Threshold: 75th Percentile of Highs
• Lower Threshold: 50th Percentile of Lows
These are calculated using linear interpolation to ensure smoother transitions across lookback periods.
2️⃣ Adaptive Signal Line
Instead of using static crossovers, HILO dynamically flips its signal based on whether price exceeds the upper threshold or falls below the lower one.
📌 If price > upper → Signal = Short threshold
📌 If price < lower → Signal = Long threshold
📌 If price remains between thresholds → no flip (trend continuation)
3️⃣ Signal Logic
✅ Long Signal → Price exceeds upper bound while lower bound acts as ceiling
❌ Short Signal → Price breaks below lower percentile while upper bound flips
This simple yet powerful mechanism creates early entries while maintaining high signal confidence.
👁 Visual & Custom Features
• 🎨 Multiple Color Modes: Strategy, Solar, Warm, Cool, Classic, Magic
• 🔄 Dynamic Candle & Band Coloring
• 🏷️ Signal Labels: Optional “𝓛𝓸𝓷𝓰” and “𝓢𝓱𝓸𝓻𝓽” tags when trend flips
• 💬 Alerts Ready: Long/Short crossover conditions can trigger alerts instantly
👥 Who Should Use HILO?
✅ Breakout Traders – Catch early trend starts using percentile filters
✅ Swing Traders – Identify directional bias shifts in advance
✅ Range Strategists – Use band confluence zones to play reversions
✅ Quant & Rule-Based Traders – Incorporate percentile logic into broader systems
⚙️ Customization & Default Settings
Percentile Length:(Default 35) Lookback for calculating percentile thresholds
Lookback Period:(Default 4) Lag factor for interpolation responsiveness
Upper % Threshold: (Default 75) Defines breakout zone from historical highs
Lower % Threshold: (Default 50) Defines retest/accumulation zone from historical lows
📌 How to Use HILO in Trading
1️⃣ Trend-Following Strategy
✔ Enter long when price flips above the adaptive support line
✔ Exit or go short when price breaks below the interpolated resistance
✔ Continue position as long as trend color persists
2️⃣ Range-Reversion Strategy
✔ Buy when price tests the lower threshold and no short signal is triggered
✔ Sell or reduce when price hits the upper range boundary
🧠 Why It Works
HILO operates on the principle that historical price structure creates natural probabilistic thresholds. By interpolating between these using percentile logic, the system maintains adaptability to changing market conditions—without the lag of moving averages or the noise of fixed bands.
🔹 Conclusion
HILO Interpolation is a minimalist yet powerful signal engine built for adaptive breakout and reversion detection. Its percentile-based logic offers a novel way to identify structure shifts, giving traders an edge in both trend and range markets.
🔹 Key Takeaways:
1️⃣ Breakout Entry Logic – Uses percentile interpolation instead of static bands
2️⃣ Color-Driven Clarity – Visual clarity via gradient zone overlays
3️⃣ Trend Integrity – Avoids overfitting and responds only to significant price movements
📌 Disclaimer: Past performance is not indicative of future results. No trading strategy can guarantee success in financial markets.
📌 Strategic Advice: Always backtest, optimize, and align parameters with your trading objectives and risk tolerance before live trading.
Open-source script
In true TradingView spirit, the creator of this script has made it open-source, so that traders can review and verify its functionality. Kudos to the author! While you can use it for free, remember that republishing the code is subject to our House Rules.
For quick access on a chart, add this script to your favorites — learn more here.
🔹 Get access to our premium tools:
whop.com/quantedgeb/ 💎
🔹 Unlock our free toolbox:
tradinglibrary.carrd.co/ 🛠️
Disclaimer: All resources and indicators provided are for educational purposes only
whop.com/quantedgeb/ 💎
🔹 Unlock our free toolbox:
tradinglibrary.carrd.co/ 🛠️
Disclaimer: All resources and indicators provided are for educational purposes only
Disclaimer
The information and publications are not meant to be, and do not constitute, financial, investment, trading, or other types of advice or recommendations supplied or endorsed by TradingView. Read more in the Terms of Use.