OPEN-SOURCE SCRIPT
Ratio Chart of Two Assets
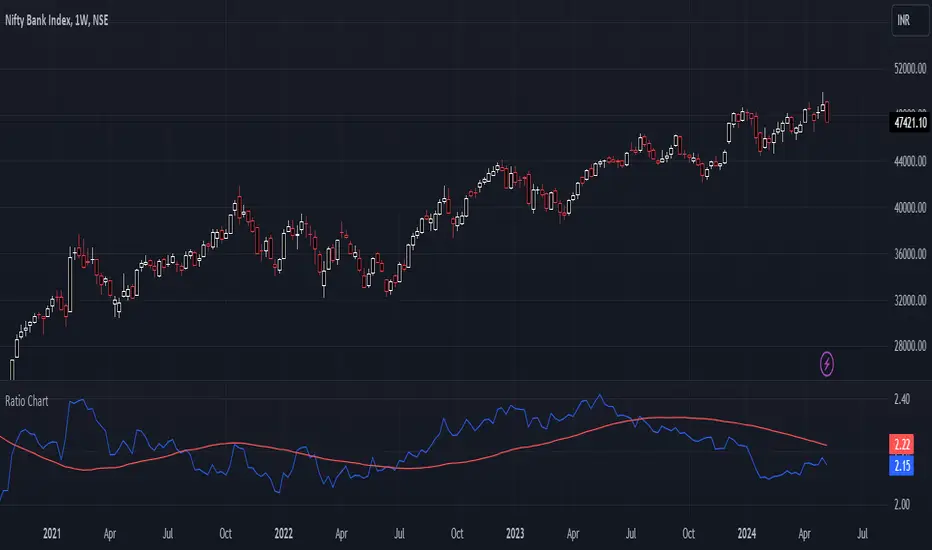
This custom Pine Script indicator allows traders and analysts to compare the performance of two distinct assets by visualizing their price ratio over time. The "Ratio Chart" indicator plots the ratio of the closing prices of any two selected assets, making it easier to observe how one asset performs relative to another within the same chart.
Features:
1. Customizable Symbols: Users can input any two ticker symbols for comparison. The default comparative symbol is set as 'NSE:NIFTY'.
2. Ratio Visualization: The main plot displays the ratio of the two asset prices, providing a straightforward view of their relative price movements.
3. Moving Average: An optional moving average can be added to the ratio plot. This helps in identifying the trend direction and smoothens out short-term fluctuations. The period of the moving average is customizable, with a default setting of 50.
Use Cases:
1. Market Analysis: Ideal for traders who wish to analyze the strength of one market relative to another, such as comparing a sector index against a broader market index.
2. Strategic Trading: Useful for pairs trading strategies, allowing traders to identify potential convergence and divergence opportunities between two correlated assets.
How to Use:
1. Add the indicator to your chart from the Indicators menu.
2. Customize the comparative symbol as required.
3. Adjust the moving average period to suit your analysis timeframe.
By providing a clear, comparative visualization of asset prices, this indicator is an invaluable tool for market analysis and trading strategy development.
Open-source script
In true TradingView spirit, the creator of this script has made it open-source, so that traders can review and verify its functionality. Kudos to the author! While you can use it for free, remember that republishing the code is subject to our House Rules.
For quick access on a chart, add this script to your favorites — learn more here.
Disclaimer
The information and publications are not meant to be, and do not constitute, financial, investment, trading, or other types of advice or recommendations supplied or endorsed by TradingView. Read more in the Terms of Use.