OPEN-SOURCE SCRIPT
ADX Screener
// Identify potential trend reversals using ADX on up to 40 crypto assets.
// ADX shows the strength of a trend, not the direction.
// By monitoring the difference of ADX values between candles, you can potentially identify reversals before they happen.
// A strong trend has a 14 period ADX slope increasing .5 or more from the prior candle.
// At a minimum, a weak trend has a 14 period ADX slope of +.25 or less, and strictly it would be decreasing.
// This indicator prints one row for each asset with three columns for ADX differences one candle back each.
// The asset name is colored green or red dependent on whether +DI > -DI or not.
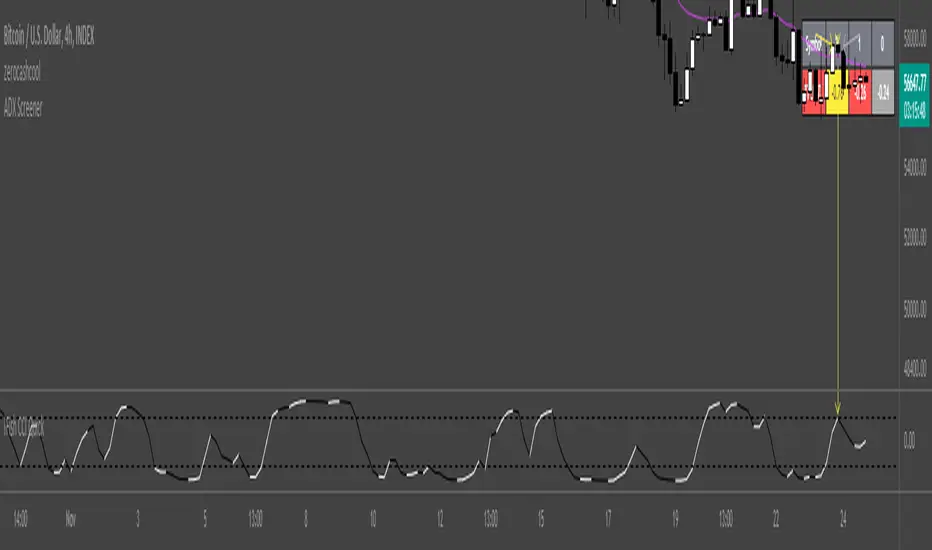
The market was in a down trend (-DI > +DI).
A bullish wave moved price up to EMA 8 resistance with strong ADX momentum (ADX diff of prior candle >= 0.5).
A Spinning Top showed that the trend was losing momentum (ADX diff lower than previous candle, showed the bullish wave losing momentum).
A Morning Star bearish reversal pattern draws resistance at the high of the pattern. (ADX Bullish momentum exhausted).
Symbol: -DI > +DI
2: Strong momentum
1: Losing momentum (spinning top)
0: Trend reversal (bearish engulfing pattern)

// ADX shows the strength of a trend, not the direction.
// By monitoring the difference of ADX values between candles, you can potentially identify reversals before they happen.
// A strong trend has a 14 period ADX slope increasing .5 or more from the prior candle.
// At a minimum, a weak trend has a 14 period ADX slope of +.25 or less, and strictly it would be decreasing.
// This indicator prints one row for each asset with three columns for ADX differences one candle back each.
// The asset name is colored green or red dependent on whether +DI > -DI or not.
The market was in a down trend (-DI > +DI).
A bullish wave moved price up to EMA 8 resistance with strong ADX momentum (ADX diff of prior candle >= 0.5).
A Spinning Top showed that the trend was losing momentum (ADX diff lower than previous candle, showed the bullish wave losing momentum).
A Morning Star bearish reversal pattern draws resistance at the high of the pattern. (ADX Bullish momentum exhausted).
Symbol: -DI > +DI
2: Strong momentum
1: Losing momentum (spinning top)
0: Trend reversal (bearish engulfing pattern)
Open-source script
In true TradingView spirit, the creator of this script has made it open-source, so that traders can review and verify its functionality. Kudos to the author! While you can use it for free, remember that republishing the code is subject to our House Rules.
For quick access on a chart, add this script to your favorites — learn more here.
Disclaimer
The information and publications are not meant to be, and do not constitute, financial, investment, trading, or other types of advice or recommendations supplied or endorsed by TradingView. Read more in the Terms of Use.