OPEN-SOURCE SCRIPT
TREND and ZL FLOW
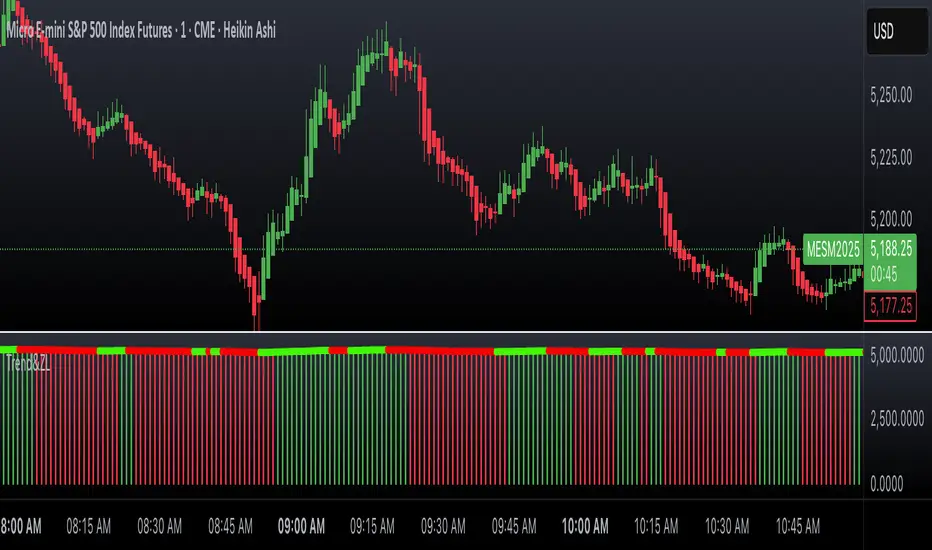
This PineScript combines two technical indicators—T3 Slow Trend Histogram and Zero Lag Moving Average to analyze market trends and potential reversals.
Giving credit to original authors of their original indicators: RedKTrader and Bjorgum
I have combined these into one indicator showing when trend is best to be trading...
When all lines are showing Green you are in a buying pressure market.
When all are lines are showing Red then you are in a selling pressure market.
T3 Slow Trend Histogram (Bjorgum):
A smoothed moving average (T3) is calculated using a recursive EMA (Exponential Moving Average) process with a length of 8 and a smoothing factor (b = 0.7). Six layers of EMAs are computed (xe1 to xe6) and combined with weighted coefficients (c1 to c4) to generate the final T3 value (nT3Average).
The histogram visually represents the T3’s momentum: green bars indicate upward momentum (T3 rising) and red bars signal downward momentum (T3 falling). This helps identify trend strength and direction.
ZL Flow (Zero-Lag Moving Average RedKTrader ):
A double-smoothed WMA (Weighted Moving Average) with a length of 9 and smoothing factor of 2 is applied to the price. The final ZLMA line is derived using a formula (2 * priceMA - ta.wma(priceMA, length)) to reduce lag.
The ZLMA line changes color (bright green for upward, red for downward) based on its direction.
Together, the T3 histogram tracks trend dynamics, while the ZL Flow provides early reversal signals, offering a dual approach to trend analysis and trade timing. The script is ideal for traders seeking confirmation of momentum shifts and zero-lag responsiveness.
Open-source script
In true TradingView spirit, the creator of this script has made it open-source, so that traders can review and verify its functionality. Kudos to the author! While you can use it for free, remember that republishing the code is subject to our House Rules.
For quick access on a chart, add this script to your favorites — learn more here.
Disclaimer
The information and publications are not meant to be, and do not constitute, financial, investment, trading, or other types of advice or recommendations supplied or endorsed by TradingView. Read more in the Terms of Use.