OPEN-SOURCE SCRIPT
True_Range_%
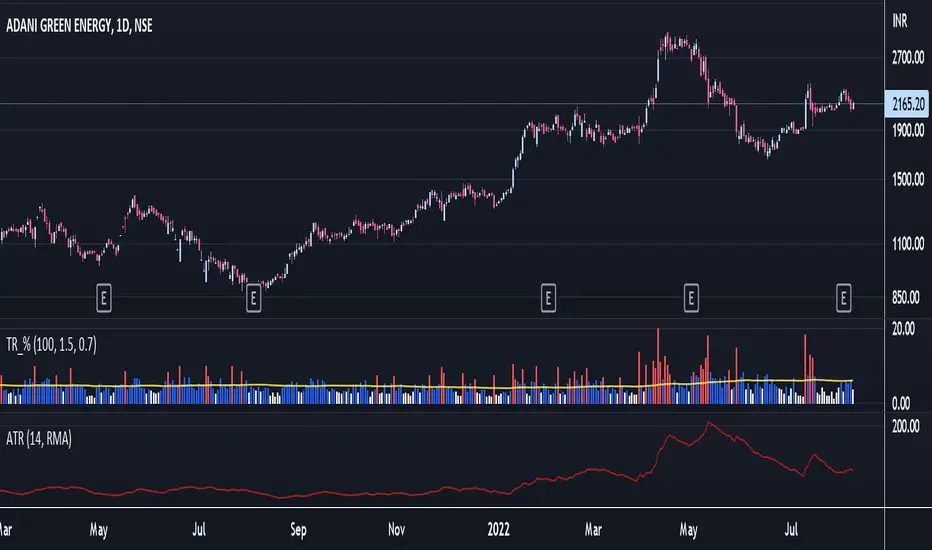
Average True range percent show the the latest true range value as percentage of previous close.
Standard ATR shows the average of absolute value of True range. This is problem when price level changes over time. Because Stocks trading at higher price level e.g $1,000 will have high ATR value as compared to stocks trading $ 50. This may look like volatility has increase recently which is of-course not true. As you can see in the chart, ATR value of period before 2020 is lower than the recent period.
True Range Percentage solves value. With this script you can also find when there is a Volatility spike (1.5 time of avg) or Low volatility (0.7 times of avg).
Volatility is cyclic in nature. It oscillates between high and low. Observing this behavior can be extremely usefully in timing entry and exits.
Open-source script
In true TradingView spirit, the creator of this script has made it open-source, so that traders can review and verify its functionality. Kudos to the author! While you can use it for free, remember that republishing the code is subject to our House Rules.
For quick access on a chart, add this script to your favorites — learn more here.
Disclaimer
The information and publications are not meant to be, and do not constitute, financial, investment, trading, or other types of advice or recommendations supplied or endorsed by TradingView. Read more in the Terms of Use.